For detailed theoretical foundations, mathematical proofs, and algorithm derivations, see Chapter 13: Edge-to-Cloud Data Ingestion and Storage in the PDF textbook.
The PDF chapter includes: - Detailed database schema design theory for time-series data - Complete REST API architecture and HTTP protocol analysis - In-depth coverage of SQL optimization for IoT workloads - Mathematical analysis of edge-cloud trade-offs and latency models - Comprehensive distributed system consistency and CAP theorem
Design a simple relational schema for IoT time-series data (devices + readings)
Implement basic and aggregate SQL queries for recent and historical sensor data
Build a small REST API for ingesting sensor readings from edge devices
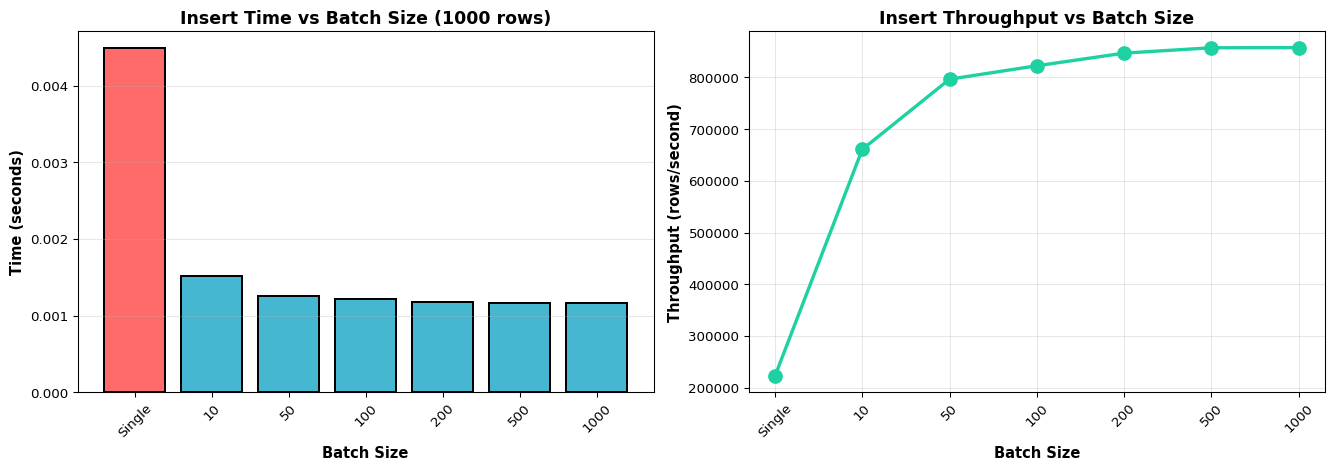
Decide between single-row vs batch inserts for different workloads
Connect an Arduino/ESP32 to your API and reason about edge vs cloud storage trade-offs
Theory Summary
Edge-to-Cloud Data Pipelines
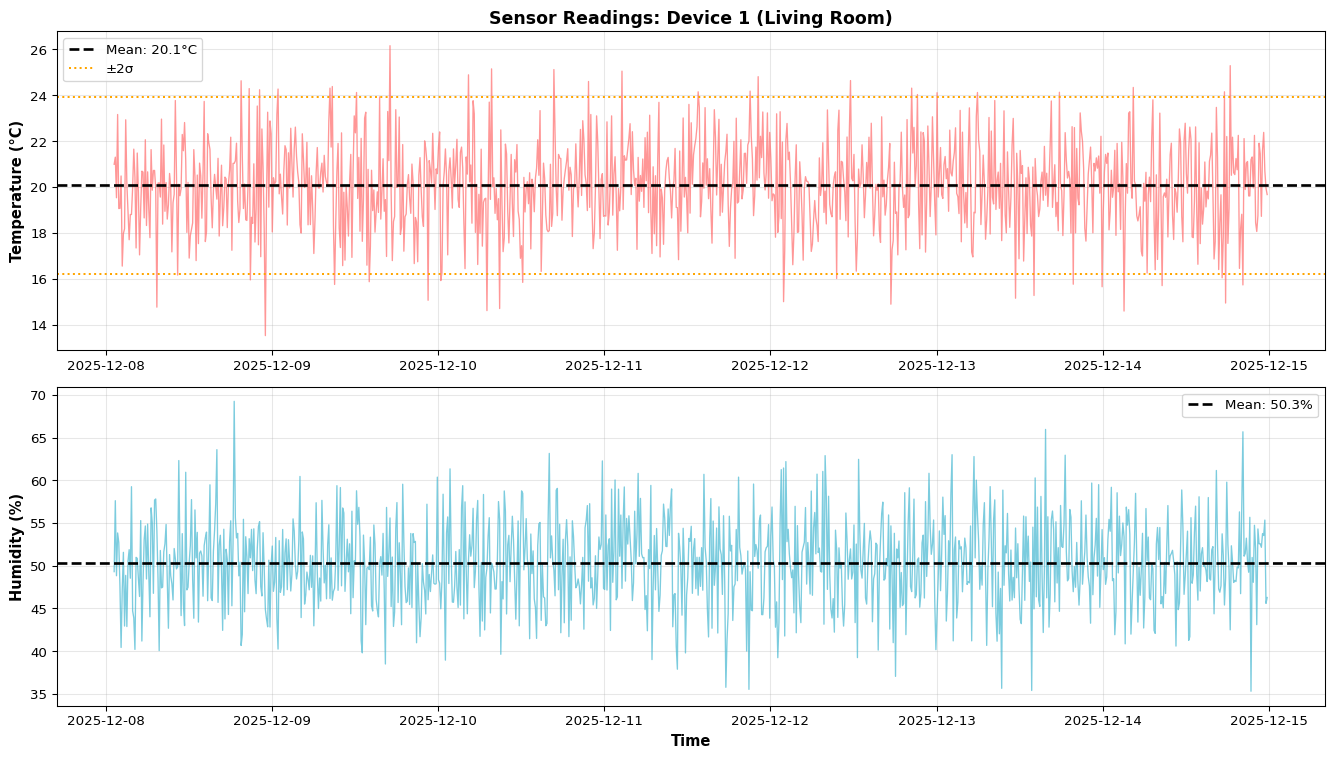
Edge devices generate continuous sensor streams, but RAM is limited and data needs to persist for historical analysis, compliance, and cross-device queries. This lab introduces distributed data architectures where edge devices send data to databases via REST APIs.
The fundamental architecture involves three layers:
Edge Devices (Arduino, ESP32) collect sensor data locally
Edge Gateway (Raspberry Pi) runs a Flask API that receives HTTP requests
Database (SQLite, MySQL, PostgreSQL) stores time-series data persistently
Unlike purely cloud-based systems, this edge-first approach keeps data close to its source, reducing latency, improving reliability during network outages, lowering bandwidth costs, and enhancing privacy. Data can optionally sync to cloud services for long-term storage and analytics.
Database Schema Design
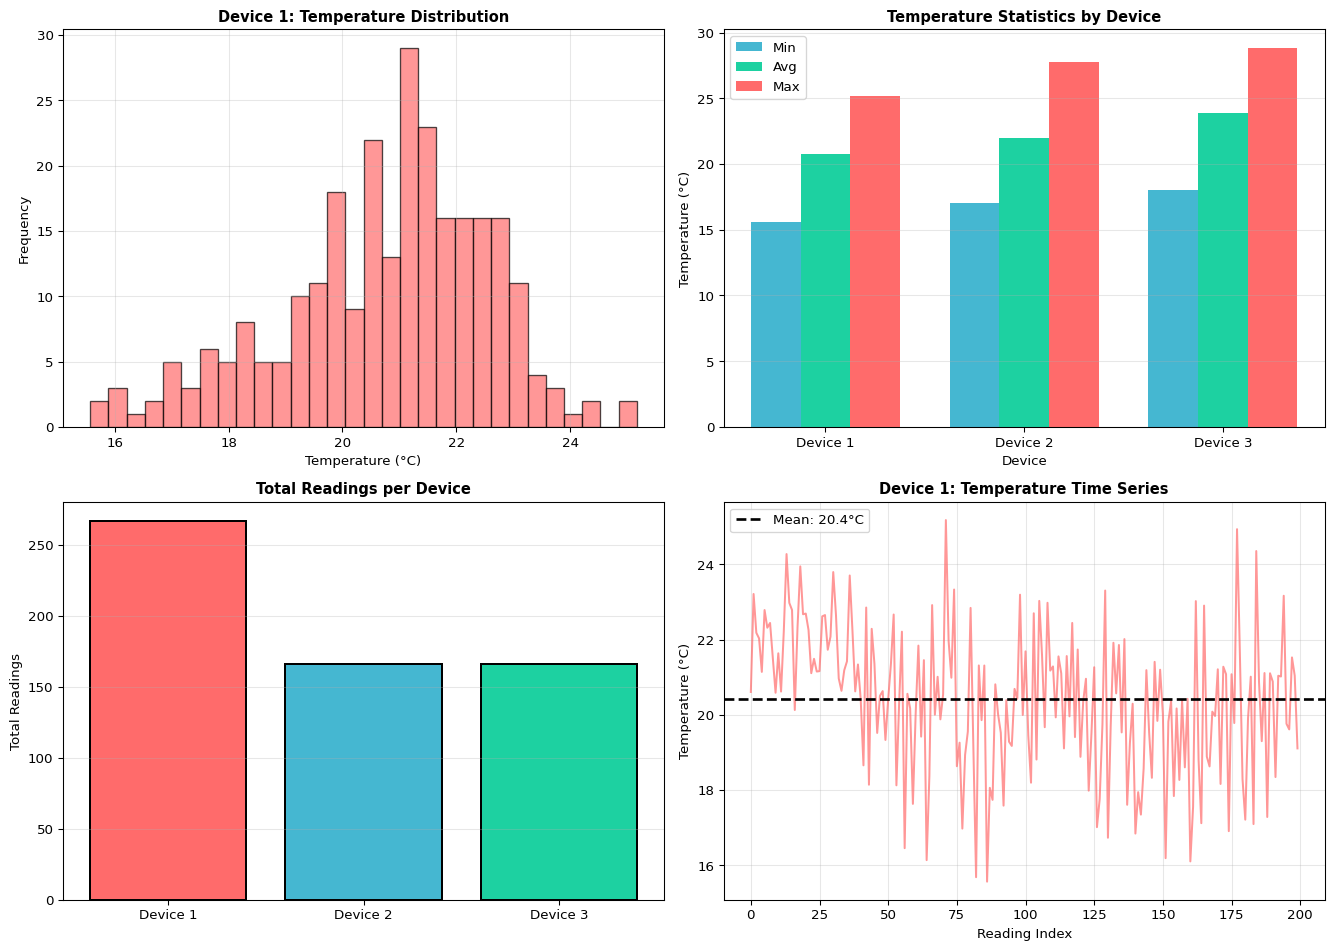
Well-designed schemas separate devices (metadata: name, type, location) from sensor_readings (time-series data: temperature, humidity, timestamps). A foreign key relationship ensures referential integrity—you can’t insert readings for non-existent devices.
Indexes on (device_id, timestamp) are critical for performance. Without indexes, queries scan every row linearly (O(n)). With proper indexes, queries complete in milliseconds even with millions of rows. However, indexes slow down INSERT operations, so design them carefully for high-frequency IoT data.
Batch vs Single Insert Performance
Single inserts commit each row individually—simple but slow (hundreds of inserts per second). Batch inserts use executemany() to commit hundreds of rows in one transaction—10-100× faster. For edge gateways buffering data from multiple sensors or replaying data after network recovery, batch inserts are essential for acceptable performance.
Key Concepts at a Glance
Core Concepts
Edge-First Storage: Keep data local for low latency, reliability, and privacy; sync to cloud optionally
Foreign Keys: Enforce referential integrity between devices and readings tables
Composite Indexes: CREATE INDEX ON readings(device_id, timestamp) speeds up time-range queries
Batch Inserts: Use executemany() for 10-100× performance improvement over single execute()
REST API: Flask endpoints accept sensor data via HTTP POST and return JSON responses
Query Optimization: Use LIMIT, WHERE with indexed columns, and aggregate functions (AVG, MIN, MAX) with GROUP BY
Common Pitfalls
Mistakes to Avoid
Forgetting Database Indexes
Your schema works fine with 1,000 rows but grinds to a halt with 1,000,000. Always add indexes on columns used in WHERE, JOIN, and ORDER BY clauses. For IoT data, CREATE INDEX ON readings(device_id, timestamp) is essential.
Ignoring Batch Insert Performance
Sending one HTTP request per sensor reading wastes bandwidth and time. Buffer 10-100 readings and send as a batch. Use executemany() instead of multiple execute() calls.
Using Unique MACs on Arduino Ethernet Shields
Multiple Arduino boards with the default MAC address cause network conflicts. Always change the MAC address: byte mac[] = { 0xDE, 0xAD, 0xBE, 0xEF, 0xFE, 0xED }; (modify the last bytes).
Missing API Error Handling
Your API should return proper HTTP status codes: 200 (OK), 400 (Bad Request for missing fields), 500 (Server Error). Validate all inputs before inserting into the database.
Not Using F() Macro on Arduino
String literals consume precious RAM on Arduino. Use F("string") to store them in flash memory instead.
Quick Reference
Key SQL Patterns
-- Latest reading per deviceSELECT*FROM sensor_readingsWHERE device_id =1ORDERBYtimestampDESCLIMIT1;-- Hourly averagesSELECT strftime('%Y-%m-%d %H', timestamp) AShour,AVG(temperature) AS avg_temp,COUNT(*) AS num_readingsFROM sensor_readingsWHERE device_id =1ANDtimestamp>= datetime('now', '-24 hours')GROUPBYhour;-- Anomaly detection (values > 2σ from mean)SELECT*FROM sensor_readingsWHERE temperature > (SELECTAVG(temperature) +2*STDEV(temperature)FROM sensor_readings);
When to Use Edge-First Storage: - Real-time control systems (latency critical) - Privacy-sensitive applications (medical, personal data) - Unreliable network connectivity (remote locations) - Bandwidth-constrained deployments
Link to Related Simulation: Explore database query patterns and performance interactively with our SQL Query Visualizer.
Related Concepts in PDF Chapter 13
Section 13.2: Database schema design with ERD diagrams
Section 13.3: Single vs batch insert performance benchmarks
Section 13.4: SQL aggregation patterns for time-series data
Test your understanding before proceeding to the exercises.
Question 1: Write a SQL query to find the average temperature per device for the last 24 hours.
Answer:
SELECT device_id,AVG(temperature) AS avg_temp,COUNT(*) AS num_readingsFROM sensor_readingsWHEREtimestamp>= datetime('now', '-24 hours')GROUPBY device_id;
This uses datetime('now', '-24 hours') for the time window, GROUP BY device_id to aggregate per device, and AVG(temperature) to compute the mean. Adding COUNT(*) shows how many readings contributed to each average. For proper performance with millions of rows, ensure you have an index: CREATE INDEX idx_device_time ON sensor_readings(device_id, timestamp);
Question 2: Your database has 1 million rows. Queries take 30 seconds without an index but 20ms with an index. Explain why.
Answer: Without an index, the database performs a full table scan checking every row sequentially (O(n) complexity). For 1 million rows, this means 1 million comparisons. With an index on (device_id, timestamp), the database uses a B-tree structure to jump directly to relevant rows (O(log n) complexity). For 1 million rows, this requires only ~20 comparisons (log₂(1,000,000) ≈ 20). The trade-off: indexes speed up SELECT queries but slow down INSERT operations because the index must be updated. For IoT data with high write rates, carefully choose which columns to index—typically device_id and timestamp.
Question 3: Compare single inserts vs batch inserts for 1000 sensor readings. Which is faster and why?
Answer: Batch inserts are 10-100× faster. Single inserts: Each INSERT commits a transaction with full ACID guarantees (disk sync, lock acquisition, index update). For 1000 inserts, this means 1000 disk syncs = seconds. Batch inserts using executemany(): All 1000 rows inserted in ONE transaction with ONE disk sync = milliseconds. Example code:
# Slow (1000 transactions)for reading in readings: cursor.execute("INSERT INTO readings VALUES (?, ?, ?)", reading)# Fast (1 transaction)cursor.executemany("INSERT INTO readings VALUES (?, ?, ?)", readings)
For edge gateways buffering data from sensors, batch inserts are essential for acceptable performance.
Question 4: Your Arduino sends HTTP requests at 1 Hz to your Flask API. After 1 hour, the database has only 1800 rows instead of 3600. What could be wrong?
Answer: Network failures, API errors, or missing error handling are likely causes. Debugging steps: (1) Check Arduino serial output for HTTP response codes—are you seeing 200 OK or 500 errors? (2) Check Flask logs for error messages or missing requests, (3) Add retry logic with exponential backoff in Arduino code, (4) Verify timestamp mismatches—if your SQL query filters by timestamp but Arduino sends Unix epoch while DB expects ISO format, rows might be inserted but not queried correctly, (5) Test network reliability—WiFi dropouts cause silent failures. Solution: Buffer readings on Arduino (SD card or EEPROM) and replay during network recovery.
Question 5: When should you use edge-first storage (Raspberry Pi + SQLite) versus cloud-only storage (AWS RDS)?
Answer:Use edge-first when: (1) Latency is critical (<10ms queries for real-time control), (2) Privacy/compliance requires data stay local (HIPAA, GDPR), (3) Network is unreliable (remote locations, mobile deployments), (4) Bandwidth costs are high or limited. Use cloud-only when: (1) Need centralized multi-device queries and analytics, (2) Data volume exceeds edge storage (TB+), (3) Guaranteed reliable internet, (4) Want managed backups and scaling. Hybrid approach (best for IoT): Store recent data (1-7 days) on edge for low-latency access, sync historical data to cloud for long-term analytics. This balances latency, reliability, and capacity.
Distributed Systems Patterns
The following sections demonstrate essential distributed systems patterns for edge analytics, building on the database and API foundations covered earlier.
MQTT Message Queue Example
MQTT (Message Queue Telemetry Transport) provides lightweight publish/subscribe messaging ideal for distributed IoT systems. Unlike HTTP’s request/response model, MQTT enables asynchronous communication where edge devices publish sensor data to topics and cloud services subscribe to receive updates.
Why MQTT for Edge Devices?
Low overhead: 2-byte headers vs 200+ bytes for HTTP
Last Will Testament: Automatic notification if device disconnects unexpectedly
Battery-friendly: Reduces power consumption for wireless sensors
Python MQTT Publisher (Edge Device)
This example simulates a temperature sensor publishing readings to an MQTT broker:
import paho.mqtt.client as mqttimport timeimport randomimport json# MQTT ConfigurationBROKER ="localhost"# Use "test.mosquitto.org" for public brokerPORT =1883TOPIC ="sensors/temperature/room1"CLIENT_ID =f"edge-sensor-{random.randint(1000, 9999)}"# Callback when connection succeedsdef on_connect(client, userdata, flags, rc):if rc ==0:print(f"Connected to MQTT broker at {BROKER}")else:print(f"Connection failed with code {rc}")# Callback when message is publisheddef on_publish(client, userdata, mid):print(f"Message {mid} published")# Initialize MQTT clientclient = mqtt.Client(CLIENT_ID)client.on_connect = on_connectclient.on_publish = on_publishtry:# Connect to broker client.connect(BROKER, PORT, keepalive=60) client.loop_start() # Start background thread for network loop# Publish sensor readings every 5 secondsfor i inrange(20):# Simulate temperature reading with drift temperature =20.0+ random.gauss(0, 2.0) # Mean 20°C, std 2°C humidity =50.0+ random.gauss(0, 10.0)# Create JSON payload payload = {"device_id": "sensor_room1","timestamp": time.time(),"temperature": round(temperature, 2),"humidity": round(humidity, 2) }# Publish with QoS 1 (at-least-once delivery) result = client.publish(TOPIC, json.dumps(payload), qos=1)if result.rc == mqtt.MQTT_ERR_SUCCESS:print(f"Published: {payload}")else:print(f"Publish failed: {result.rc}") time.sleep(5)exceptKeyboardInterrupt:print("Interrupted by user")finally: client.loop_stop() client.disconnect()print("Disconnected from MQTT broker")
Python MQTT Subscriber (Cloud Service)
This subscriber receives sensor data and stores it in a database:
import paho.mqtt.client as mqttimport jsonimport sqlite3from datetime import datetimeBROKER ="localhost"PORT =1883TOPIC ="sensors/temperature/#"# Wildcard: subscribe to all temperature topicsCLIENT_ID ="cloud-aggregator"# Initialize databaseconn = sqlite3.connect("mqtt_data.db")cursor = conn.cursor()cursor.execute(""" CREATE TABLE IF NOT EXISTS sensor_readings ( id INTEGER PRIMARY KEY AUTOINCREMENT, device_id TEXT, timestamp REAL, temperature REAL, humidity REAL, received_at TEXT )""")conn.commit()def on_connect(client, userdata, flags, rc):if rc ==0:print(f"Subscriber connected to {BROKER}") client.subscribe(TOPIC)print(f"Subscribed to topic: {TOPIC}")else:print(f"Connection failed: {rc}")def on_message(client, userdata, msg):"""Handle incoming MQTT messages"""try:# Parse JSON payload payload = json.loads(msg.payload.decode()) device_id = payload["device_id"] timestamp = payload["timestamp"] temperature = payload["temperature"] humidity = payload["humidity"]# Insert into database cursor.execute(""" INSERT INTO sensor_readings (device_id, timestamp, temperature, humidity, received_at) VALUES (?, ?, ?, ?, ?) """, (device_id, timestamp, temperature, humidity, datetime.now().isoformat())) conn.commit()print(f"Stored: {device_id} | Temp: {temperature}°C | Humidity: {humidity}%")# Check for anomaliesif temperature >30or temperature <10:print(f"⚠️ ALERT: Abnormal temperature detected: {temperature}°C")exceptExceptionas e:print(f"Error processing message: {e}")# Initialize subscriberclient = mqtt.Client(CLIENT_ID)client.on_connect = on_connectclient.on_message = on_messagetry: client.connect(BROKER, PORT, keepalive=60)print("MQTT Subscriber running. Press Ctrl+C to stop.") client.loop_forever() # Blocking call that processes network trafficexceptKeyboardInterrupt:print("\nShutting down subscriber...")finally: conn.close() client.disconnect()
MQTT Best Practices for Edge
Use unique client IDs: Generate from device MAC address or UUID to prevent conflicts
Set appropriate QoS: Use QoS 0 for non-critical telemetry, QoS 1 for important data
Implement reconnection logic: Handle broker failures with exponential backoff
Use Last Will: Set client.will_set() to notify subscribers if device crashes
Optimize topic structure: Use hierarchy like building/floor/room/sensor_type
Secure with TLS: Use port 8883 with certificates for production deployments
Distributed Inference Coordinator
In multi-device edge deployments, a coordinator pattern distributes inference tasks across multiple edge nodes. This example shows a simple round-robin coordinator that balances workload.
import timeimport threadingimport queuefrom dataclasses import dataclassfrom typing import List, Dictfrom enum import Enumclass NodeStatus(Enum): IDLE ="idle" BUSY ="busy" OFFLINE ="offline"@dataclassclass EdgeNode:"""Represents an edge device capable of running inference""" node_id: str ip_address: str model_type: str# e.g., "image_classification", "object_detection" status: NodeStatus = NodeStatus.IDLE last_heartbeat: float=0.0 tasks_completed: int=0def is_alive(self, timeout=30):"""Check if node has sent heartbeat within timeout"""return (time.time() -self.last_heartbeat) < timeoutclass InferenceCoordinator:"""Coordinates inference tasks across multiple edge nodes"""def__init__(self):self.nodes: Dict[str, EdgeNode] = {}self.task_queue = queue.Queue()self.results_queue = queue.Queue()self.next_node_idx =0# For round-robin schedulingself.lock = threading.Lock()def register_node(self, node: EdgeNode):"""Register a new edge node with the coordinator"""withself.lock:self.nodes[node.node_id] = node node.last_heartbeat = time.time()print(f"✓ Registered node: {node.node_id} ({node.model_type})")def update_heartbeat(self, node_id: str):"""Update node's last seen timestamp"""withself.lock:if node_id inself.nodes:self.nodes[node_id].last_heartbeat = time.time()self.nodes[node_id].status = NodeStatus.IDLEdef get_available_nodes(self, model_type: str=None) -> List[EdgeNode]:"""Get list of available nodes, optionally filtered by model type""" available = []withself.lock:for node inself.nodes.values():if node.is_alive() and node.status == NodeStatus.IDLE:if model_type isNoneor node.model_type == model_type: available.append(node)return availabledef assign_task(self, task_data: dict) ->str:""" Assign inference task to next available node (round-robin). Returns assigned node_id or None if no nodes available. """ model_type = task_data.get("model_type") available =self.get_available_nodes(model_type)ifnot available:print(f"⚠️ No available nodes for model type: {model_type}")returnNone# Round-robin selectionwithself.lock: node = available[self.next_node_idx %len(available)]self.next_node_idx +=1 node.status = NodeStatus.BUSYprint(f"→ Assigned task to {node.node_id}: {task_data['task_id']}")# In real implementation, send task via HTTP/MQTT to node.ip_addressreturn node.node_iddef complete_task(self, node_id: str, task_id: str, result: dict):"""Mark task as completed and store result"""withself.lock:if node_id inself.nodes: node =self.nodes[node_id] node.status = NodeStatus.IDLE node.tasks_completed +=1 result["node_id"] = node_id result["task_id"] = task_idself.results_queue.put(result)print(f"✓ Task {task_id} completed by {node_id}")def get_cluster_stats(self) ->dict:"""Get statistics about the edge cluster"""withself.lock: total =len(self.nodes) alive =sum(1for n inself.nodes.values() if n.is_alive()) idle =sum(1for n inself.nodes.values()if n.is_alive() and n.status == NodeStatus.IDLE) busy =sum(1for n inself.nodes.values()if n.is_alive() and n.status == NodeStatus.BUSY) total_tasks =sum(n.tasks_completed for n inself.nodes.values())return {"total_nodes": total,"alive_nodes": alive,"idle_nodes": idle,"busy_nodes": busy,"total_tasks_completed": total_tasks }def health_check_loop(self, interval=10):"""Periodically check node health (run in background thread)"""whileTrue: time.sleep(interval)withself.lock:for node inself.nodes.values():ifnot node.is_alive():if node.status != NodeStatus.OFFLINE:print(f"⚠️ Node {node.node_id} went offline") node.status = NodeStatus.OFFLINE# Example usageif__name__=="__main__": coordinator = InferenceCoordinator()# Register edge nodes coordinator.register_node(EdgeNode("edge-pi-01", "192.168.1.101", "image_classification")) coordinator.register_node(EdgeNode("edge-pi-02", "192.168.1.102", "image_classification")) coordinator.register_node(EdgeNode("edge-jetson-01", "192.168.1.103", "object_detection"))# Start health check in background health_thread = threading.Thread(target=coordinator.health_check_loop, daemon=True) health_thread.start()# Simulate task assignmentfor i inrange(5): task = {"task_id": f"task_{i:03d}","model_type": "image_classification","image_path": f"/data/image_{i}.jpg" } node_id = coordinator.assign_task(task)if node_id:# Simulate task completion after 2 seconds time.sleep(2) coordinator.complete_task(node_id, task["task_id"], {"prediction": "cat", "confidence": 0.95})# Print cluster statistics stats = coordinator.get_cluster_stats()print(f"\nCluster Stats: {stats}")
Coordinator Pitfalls
Single Point of Failure
If the coordinator crashes, the entire cluster becomes unresponsive. Solution: Implement leader election with multiple coordinator replicas (use Raft or Paxos consensus).
Task Queue Overflow
If tasks arrive faster than nodes can process, the queue grows unbounded. Solution: Set max queue size and reject new tasks when full, or use priority queues.
Stale Node State
Network delays can cause outdated status information. Solution: Use pessimistic locking (assume busy until confirmed) and timeout-based state transitions.
Edge Synchronization Example
Edge devices often need to synchronize state or share data with peers. This example demonstrates eventual consistency with conflict resolution.
import timeimport hashlibimport jsonfrom typing import Dict, Any, Tuplefrom dataclasses import dataclass, fieldfrom datetime import datetime@dataclassclass VersionedValue:"""Value with vector clock for tracking causality""" value: Any timestamp: float node_id: str version: int=1def to_dict(self):return {"value": self.value,"timestamp": self.timestamp,"node_id": self.node_id,"version": self.version }class EdgeDataStore:""" Distributed key-value store with eventual consistency. Uses last-write-wins conflict resolution. """def__init__(self, node_id: str):self.node_id = node_idself.data: Dict[str, VersionedValue] = {}self.sync_log = [] # Track synchronization eventsdef put(self, key: str, value: Any) ->None:"""Store a value locally with version metadata"""if key inself.data:# Increment version for updates old_version =self.data[key].version new_version = old_version +1else: new_version =1 versioned = VersionedValue( value=value, timestamp=time.time(), node_id=self.node_id, version=new_version )self.data[key] = versionedprint(f"[{self.node_id}] PUT {key} = {value} (v{new_version})")def get(self, key: str) -> Any:"""Retrieve a value"""if key inself.data:returnself.data[key].valuereturnNonedef get_versioned(self, key: str) -> VersionedValue:"""Get value with metadata"""returnself.data.get(key)def sync_with_peer(self, peer_store: 'EdgeDataStore') -> Tuple[int, int, int]:""" Synchronize data with another edge node. Returns (keys_sent, keys_received, conflicts_resolved) """ keys_sent =0 keys_received =0 conflicts =0# Get all keys from both stores all_keys =set(self.data.keys()) |set(peer_store.data.keys())for key in all_keys: local_val =self.get_versioned(key) peer_val = peer_store.get_versioned(key)# Case 1: Key only exists locally - send to peerif peer_val isNone: peer_store.data[key] = local_val keys_sent +=1print(f" → Sent {key} to {peer_store.node_id}")# Case 2: Key only exists on peer - receive from peerelif local_val isNone:self.data[key] = peer_val keys_received +=1print(f" ← Received {key} from {peer_store.node_id}")# Case 3: Key exists on both - resolve conflictelse: winner =self._resolve_conflict(key, local_val, peer_val)if winner != local_val:self.data[key] = winner conflicts +=1print(f" ⚡ Conflict on {key}: chose {winner.node_id}'s version")if winner != peer_val: peer_store.data[key] = winnerself.sync_log.append({"timestamp": time.time(),"peer": peer_store.node_id,"sent": keys_sent,"received": keys_received,"conflicts": conflicts })return (keys_sent, keys_received, conflicts)def _resolve_conflict(self, key: str, val1: VersionedValue, val2: VersionedValue) -> VersionedValue:""" Resolve conflicts using Last-Write-Wins (LWW) strategy. Fallback to node_id comparison for ties. """# Compare timestamps (last write wins)if val1.timestamp != val2.timestamp:return val1 if val1.timestamp > val2.timestamp else val2# Timestamps equal - use node_id as tiebreakerreturn val1 if val1.node_id > val2.node_id else val2def get_checksum(self) ->str:"""Compute checksum of entire datastore for verification""" content = json.dumps({k: v.to_dict() for k, v insorted(self.data.items())})return hashlib.md5(content.encode()).hexdigest()# Example usage: Multi-node edge synchronizationif__name__=="__main__":# Create three edge nodes node_a = EdgeDataStore("edge-node-A") node_b = EdgeDataStore("edge-node-B") node_c = EdgeDataStore("edge-node-C")print("=== Initial State ===")# Each node collects different sensor data node_a.put("temperature", 22.5) node_a.put("humidity", 60) node_b.put("temperature", 23.0) # Slightly different reading node_b.put("pressure", 1013) node_c.put("light_level", 450) time.sleep(1) # Simulate time passingprint("\n=== Synchronization Round 1: A ↔ B ===") sent, recv, conflicts = node_a.sync_with_peer(node_b)print(f"Summary: sent={sent}, received={recv}, conflicts={conflicts}")print("\n=== Synchronization Round 2: B ↔ C ===") sent, recv, conflicts = node_b.sync_with_peer(node_c)print(f"Summary: sent={sent}, received={recv}, conflicts={conflicts}")print("\n=== Synchronization Round 3: A ↔ C ===") sent, recv, conflicts = node_a.sync_with_peer(node_c)print(f"Summary: sent={sent}, received={recv}, conflicts={conflicts}")print("\n=== Final State ===")for node in [node_a, node_b, node_c]:print(f"{node.node_id}: {list(node.data.keys())} | Checksum: {node.get_checksum()[:8]}")# Verify eventual consistencyif node_a.get_checksum() == node_b.get_checksum() == node_c.get_checksum():print("✓ All nodes converged to same state (eventual consistency achieved)")else:print("✗ Nodes have different states - consistency not achieved")
Synchronization Strategies
Last-Write-Wins (LWW): Simple but can lose data. Good for sensor readings where latest value matters.
Vector Clocks: Track causality across nodes. Detects concurrent writes but requires more metadata.
CRDTs (Conflict-Free Replicated Data Types): Guarantee convergence without coordination. Use for counters, sets, or registers.
Application-Level Merge: Custom conflict resolution based on domain logic (e.g., take max temperature, merge alert lists).
CAP Theorem Demonstration
The CAP theorem states distributed systems can provide only 2 of 3 guarantees: Consistency, Availability, Partition tolerance. This example demonstrates trade-offs.
import timeimport randomimport threadingfrom enum import Enumfrom typing import Optional, Listclass ConsistencyModel(Enum): STRONG ="strong"# CP: Consistent + Partition-tolerant EVENTUAL ="eventual"# AP: Available + Partition-tolerantclass Node:"""Represents a distributed database node"""def__init__(self, node_id: str, consistency: ConsistencyModel):self.node_id = node_idself.consistency = consistencyself.data = {}self.is_partitioned =False# Simulates network partitionself.connected_nodes: List['Node'] = []self.lock = threading.Lock()self.write_count =0self.read_count =0def connect_to(self, other_node: 'Node'):"""Establish bidirectional connection"""if other_node notinself.connected_nodes:self.connected_nodes.append(other_node) other_node.connected_nodes.append(self)def partition(self):"""Simulate network partition"""self.is_partitioned =Trueprint(f"⚠️ {self.node_id} is now partitioned from the network")def heal(self):"""Restore network connectivity"""self.is_partitioned =Falseprint(f"✓ {self.node_id} network partition healed")def write(self, key: str, value: any, timeout: float=2.0) ->bool:""" Write data with consistency guarantees. Returns True if write succeeds, False otherwise. """ start_time = time.time()ifself.consistency == ConsistencyModel.STRONG:returnself._strong_consistency_write(key, value, timeout)else:returnself._eventual_consistency_write(key, value, timeout)def _strong_consistency_write(self, key: str, value: any, timeout: float) ->bool:""" CP System: Require majority quorum before write succeeds. Sacrifices availability during partitions. """# Count reachable nodes (including self) reachable = [self] + [n for n inself.connected_nodes ifnot n.is_partitioned] total_nodes =len(self.connected_nodes) +1 quorum_size = (total_nodes //2) +1# Majorityiflen(reachable) < quorum_size:print(f"✗ {self.node_id}: WRITE REJECTED (no quorum: {len(reachable)}/{quorum_size})")returnFalse# Write to all reachable nodeswithself.lock:self.data[key] = valueself.write_count +=1for node in reachable:if node !=self:with node.lock: node.data[key] = valueprint(f"✓ {self.node_id}: WRITE COMMITTED {key}={value} (quorum: {len(reachable)}/{total_nodes})")returnTruedef _eventual_consistency_write(self, key: str, value: any, timeout: float) ->bool:""" AP System: Always accept writes locally. Sacrifices consistency - eventual convergence when partition heals. """withself.lock:self.data[key] = valueself.write_count +=1print(f"✓ {self.node_id}: WRITE ACCEPTED {key}={value} (local only)")# Async replication to reachable nodes (fire-and-forget)def replicate():for node inself.connected_nodes:ifnot node.is_partitioned:with node.lock: node.data[key] = value threading.Thread(target=replicate, daemon=True).start()returnTruedef read(self, key: str) -> Optional[any]:"""Read data from local node"""withself.lock:self.read_count +=1 value =self.data.get(key)print(f" {self.node_id}: READ {key} → {value}")return valuedef get_stats(self) ->dict:"""Return node statistics"""return {"node_id": self.node_id,"consistency": self.consistency.value,"partitioned": self.is_partitioned,"keys": len(self.data),"writes": self.write_count,"reads": self.read_count }# Demonstrationdef demonstrate_cap_theorem():print("="*60)print("CAP THEOREM DEMONSTRATION")print("="*60)# Scenario 1: CP System (Strong Consistency)print("\n### Scenario 1: CP System (Strong Consistency) ###\n") node1_cp = Node("Node1-CP", ConsistencyModel.STRONG) node2_cp = Node("Node2-CP", ConsistencyModel.STRONG) node3_cp = Node("Node3-CP", ConsistencyModel.STRONG) node1_cp.connect_to(node2_cp) node1_cp.connect_to(node3_cp) node2_cp.connect_to(node3_cp)# All nodes healthy - writes succeedprint("1. All nodes healthy:") node1_cp.write("temperature", 22.5)# Partition node3 - still have quorum (2/3)print("\n2. Partition one node (quorum maintained):") node3_cp.partition() node1_cp.write("temperature", 23.0)# Partition node2 - lose quorum (1/3)print("\n3. Partition second node (quorum lost):") node2_cp.partition() success = node1_cp.write("temperature", 24.0)print(f"\n→ CP System: Chose CONSISTENCY over AVAILABILITY")print(f" During partition, writes are rejected to prevent inconsistency")# Scenario 2: AP System (Eventual Consistency)print("\n"+"="*60)print("### Scenario 2: AP System (Eventual Consistency) ###\n") node1_ap = Node("Node1-AP", ConsistencyModel.EVENTUAL) node2_ap = Node("Node2-AP", ConsistencyModel.EVENTUAL) node3_ap = Node("Node3-AP", ConsistencyModel.EVENTUAL) node1_ap.connect_to(node2_ap) node1_ap.connect_to(node3_ap) node2_ap.connect_to(node3_ap)# All nodes healthyprint("1. All nodes healthy:") node1_ap.write("temperature", 22.5) time.sleep(0.1) # Allow replication# Partition nodes - writes still acceptedprint("\n2. Partition two nodes (create split-brain):") node2_ap.partition() node3_ap.partition() node1_ap.write("temperature", 23.0) # Write to node1 time.sleep(0.1) node2_ap.write("temperature", 25.5) # Concurrent write to node2!print("\n3. Read from different nodes (inconsistent):") node1_ap.read("temperature") node2_ap.read("temperature")# Heal partition - eventual consistencyprint("\n4. Heal partition (eventual convergence):") node2_ap.heal() node3_ap.heal() time.sleep(0.2) # Allow syncprint(f"\n→ AP System: Chose AVAILABILITY over CONSISTENCY")print(f" During partition, writes accepted but data temporarily inconsistent")print(f" System eventually converges when partition heals")# Summaryprint("\n"+"="*60)print("SUMMARY: CAP THEOREM TRADE-OFFS")print("="*60)print("\nCP System (Strong Consistency):")print(" ✓ Always consistent reads")print(" ✓ No split-brain scenarios")print(" ✗ Unavailable during partitions")print(" Use case: Banking, inventory, critical IoT control")print("\nAP System (Eventual Consistency):")print(" ✓ Always available for reads/writes")print(" ✓ Resilient to network failures")print(" ✗ Temporary inconsistencies")print(" Use case: Sensor telemetry, social media, caching")print("\n"+"="*60)if__name__=="__main__": demonstrate_cap_theorem()
CAP Theorem for Edge Analytics
Consistency (C): All nodes see the same data at the same time - Example: All edge devices report identical model version - Requires: Coordination, quorum, locks
Availability (A): Every request receives a response (success or failure) - Example: Sensor readings always accepted, even during network outage - Requires: Local processing, asynchronous replication
Partition Tolerance (P): System continues operating despite network failures - Example: Edge devices work when cloud connection drops - Requires: Distributed architecture (unavoidable in edge systems)
Edge systems typically choose AP: Edge devices must continue operating during network outages, accepting temporary inconsistencies. Synchronization happens when connectivity is restored.
Choosing Your CAP Priorities
Choose CP (Consistency + Partition Tolerance) when: - Data correctness is critical (financial transactions, medical records) - Stale data is dangerous (actuator commands, safety systems) - Acceptable to block operations during failures - Example: Distributed locking for actuator control
Choose AP (Availability + Partition Tolerance) when: - System must always respond (sensor data collection, monitoring) - Temporary staleness is acceptable (cached predictions, telemetry) - Read-heavy workloads with infrequent conflicts - Example: Multi-sensor aggregation, edge analytics dashboards
Hybrid Approach (common in edge systems): - Critical control path: CP (actuators, safety) - Telemetry and monitoring: AP (sensors, logs) - Use application-specific conflict resolution
Practical Exercises
Exercise 1: Extend MQTT subscriber to detect sensor failures
Challenge: Modify the MQTT subscriber to detect when a sensor stops publishing (hasn’t sent data in 60 seconds) and send an alert.
Hints: - Track last seen timestamp per device_id - Use a background thread that checks timestamps every 30 seconds - Publish alerts to a separate topic: alerts/sensor_offline
Exercise 2: Implement priority-based task scheduling in coordinator
Challenge: Extend the InferenceCoordinator to support task priorities (HIGH, MEDIUM, LOW). High-priority tasks should be assigned before low-priority ones.
Hints: - Use queue.PriorityQueue instead of regular queue - Store tasks as tuples: (priority, timestamp, task_data) - Lower priority number = higher priority (HIGH=0, MEDIUM=1, LOW=2)
Solution approach:
from queue import PriorityQueueclass Priority(Enum): HIGH =0 MEDIUM =1 LOW =2task_queue = PriorityQueue()task_queue.put((Priority.HIGH.value, time.time(), task_data))priority, timestamp, task = task_queue.get() # Gets highest priority first
::: {.callout-note collapse=“true” title=“Exercise 3: Add vector clocks to edge synchronization”> Challenge: Replace timestamp-based conflict resolution with vector clocks to detect concurrent writes.
Hints: - Vector clock is a dict mapping node_id → version number - Increment own version on each write - Merge by taking max of each node’s version - Concurrent if neither vector dominates the other
For IoT/Edge systems, we typically choose AP (Availability + Partition Tolerance): - Sensors must continue collecting data during network outages - We accept eventual consistency - data syncs when connection restores
1.2 Consistency Models
Model
Guarantee
Use Case
Strong Consistency
Reads always return latest write
Financial transactions
Eventual Consistency
Reads eventually return latest write
Sensor telemetry
Causal Consistency
Related events maintain order
User actions
For sensor data, eventual consistency is usually sufficient:\(\text{If no new updates, all replicas converge to same value}\)
Section 2: Time-Series Data Modeling
2.1 Time-Series Data Characteristics
IoT sensor data is time-series data with unique properties:
Characteristic
Description
Implication
Time-ordered
Data arrives in temporal sequence
Index on timestamp
Append-only
New data added, rarely updated
Optimize for inserts
High volume
Millions of data points
Compression, downsampling
Query patterns
Time-range queries dominate
Time-based partitioning
2.2 Schema Design Principles
Narrow vs Wide Tables:
-- NARROW: One row per sensor per timestamp (normalized)-- Pros: Flexible, easy to add sensors-- Cons: More rows, joins neededCREATETABLE readings_narrow (timestamp DATETIME, device_id INTEGER, metric_name TEXT,valueREAL);-- WIDE: All metrics in one row (denormalized)-- Pros: Fewer rows, faster queries-- Cons: Schema changes when adding sensorsCREATETABLE readings_wide (timestamp DATETIME, device_id INTEGER, temperature REAL, humidity REAL, light INTEGER);
For IoT, wide tables are generally preferred for query performance.
2.3 Indexing Strategy
Composite index on (timestamp, device_id) optimizes common queries:
\(\text{Query Time} = O(\log n) \text{ with B-tree index vs } O(n) \text{ without}\)
Section 3: Edge Data Manager
3.1 Write-Ahead Logging
To prevent data loss during crashes, databases use Write-Ahead Logging (WAL):
1. Write to log (persistent)
2. Acknowledge to client
3. Apply to database (async)
SQLite’s WAL mode is ideal for IoT: - Readers don’t block writers - Better performance for write-heavy workloads - Crash recovery from log
Section 4: Generating and Storing Time-Series Data
EXPLAINQUERYPLANSELECT*FROM sensor_readings WHERE device_id =1ANDtimestamp>'2024-01-01';-- Should show: USING INDEX idx_readings_device_time
Section 6: Edge-Cloud Synchronization
6.1 Sync Strategies
Strategy
Description
When to Use
Push-based
Edge sends immediately
Low latency, reliable network
Pull-based
Cloud requests data
Cloud-controlled, polling
Store-and-forward
Buffer locally, sync later
Unreliable network, batch
Delta sync
Send only changes
Bandwidth optimization
6.2 Conflict Resolution
When same data is modified in multiple places:
Last-Writer-Wins (LWW): Latest timestamp wins
First-Writer-Wins: Reject later updates
Merge: Combine changes (complex)
For sensor data, LWW is usually sufficient since readings are append-only.
Section 7: Data Retention and Downsampling
7.1 The Storage Problem
Sensor data grows unbounded. At 1 reading/second per device:
Devices
Daily Readings
Daily Storage
Yearly Storage
10
864,000
~35 MB
~12 GB
100
8,640,000
~350 MB
~120 GB
1,000
86,400,000
~3.5 GB
~1.2 TB
7.2 Retention Policies
Tiered retention: - Hot: Last 24 hours - full resolution - Warm: Last 7 days - hourly aggregates - Cold: Last 30 days - daily aggregates - Archive: Beyond 30 days - delete or archive
7.3 Downsampling Algorithms
Largest Triangle Three Buckets (LTTB): Preserves visual shape with fewer points
Simple aggregation: Average/min/max per time bucket
Section 8: Edge vs Cloud Storage Trade-offs
8.1 Decision Matrix
Factor
Edge Storage
Cloud Storage
Hybrid
Latency
<10ms
50-500ms
Varies
Offline Access
Full
None
Partial
Storage Capacity
Limited (GB)
Unlimited
Combined
Query Power
Basic
Advanced
Tiered
Cost
Hardware
Per-query/storage
Optimized
Privacy
Data stays local
Data leaves device
Controlled
Section 9: HTTP API and Arduino Integration
9.1 RESTful API Design
For Level 2/3 deployment, create a Flask API on Raspberry Pi:
---title: "LAB13: Distributed Data"subtitle: "Edge-to-Cloud Data Pipelines"---::: {.callout-note}## PDF Textbook ReferenceFor detailed theoretical foundations, mathematical proofs, and algorithm derivations, see **Chapter 13: Edge-to-Cloud Data Ingestion and Storage** in the [PDF textbook](../downloads/Edge-Analytics-Lab-Book-v1.0.0.pdf).The PDF chapter includes:- Detailed database schema design theory for time-series data- Complete REST API architecture and HTTP protocol analysis- In-depth coverage of SQL optimization for IoT workloads- Mathematical analysis of edge-cloud trade-offs and latency models- Comprehensive distributed system consistency and CAP theorem:::[](https://colab.research.google.com/github/ngcharithperera/edge-analytics-lab-book/blob/main/notebooks/LAB13_distributed.ipynb)[Download Notebook](https://raw.githubusercontent.com/ngcharithperera/edge-analytics-lab-book/main/notebooks/LAB13_distributed.ipynb)## Learning ObjectivesBy the end of this lab you should be able to:- Design a simple relational schema for IoT time-series data (devices + readings)- Implement basic and aggregate SQL queries for recent and historical sensor data- Build a small REST API for ingesting sensor readings from edge devices- Decide between single-row vs batch inserts for different workloads- Connect an Arduino/ESP32 to your API and reason about edge vs cloud storage trade-offs## Theory Summary### Edge-to-Cloud Data PipelinesEdge devices generate continuous sensor streams, but RAM is limited and data needs to persist for historical analysis, compliance, and cross-device queries. This lab introduces distributed data architectures where edge devices send data to databases via REST APIs.The fundamental architecture involves three layers:1. **Edge Devices** (Arduino, ESP32) collect sensor data locally2. **Edge Gateway** (Raspberry Pi) runs a Flask API that receives HTTP requests3. **Database** (SQLite, MySQL, PostgreSQL) stores time-series data persistentlyUnlike purely cloud-based systems, this edge-first approach keeps data close to its source, reducing latency, improving reliability during network outages, lowering bandwidth costs, and enhancing privacy. Data can optionally sync to cloud services for long-term storage and analytics.### Database Schema DesignWell-designed schemas separate **devices** (metadata: name, type, location) from **sensor_readings** (time-series data: temperature, humidity, timestamps). A foreign key relationship ensures referential integrity—you can't insert readings for non-existent devices.Indexes on `(device_id, timestamp)` are critical for performance. Without indexes, queries scan every row linearly (O(n)). With proper indexes, queries complete in milliseconds even with millions of rows. However, indexes slow down `INSERT` operations, so design them carefully for high-frequency IoT data.### Batch vs Single Insert PerformanceSingle inserts commit each row individually—simple but slow (hundreds of inserts per second). Batch inserts use `executemany()` to commit hundreds of rows in one transaction—10-100× faster. For edge gateways buffering data from multiple sensors or replaying data after network recovery, batch inserts are essential for acceptable performance.## Key Concepts at a Glance::: {.callout-note icon=false}## Core Concepts- **Edge-First Storage**: Keep data local for low latency, reliability, and privacy; sync to cloud optionally- **Foreign Keys**: Enforce referential integrity between devices and readings tables- **Composite Indexes**: `CREATE INDEX ON readings(device_id, timestamp)` speeds up time-range queries- **Batch Inserts**: Use `executemany()` for 10-100× performance improvement over single `execute()`- **REST API**: Flask endpoints accept sensor data via HTTP POST and return JSON responses- **Query Optimization**: Use `LIMIT`, `WHERE` with indexed columns, and aggregate functions (`AVG`, `MIN`, `MAX`) with `GROUP BY`:::## Common Pitfalls::: {.callout-warning}## Mistakes to Avoid**Forgetting Database Indexes**: Your schema works fine with 1,000 rows but grinds to a halt with 1,000,000. Always add indexes on columns used in `WHERE`, `JOIN`, and `ORDER BY` clauses. For IoT data, `CREATE INDEX ON readings(device_id, timestamp)` is essential.**Ignoring Batch Insert Performance**: Sending one HTTP request per sensor reading wastes bandwidth and time. Buffer 10-100 readings and send as a batch. Use `executemany()` instead of multiple `execute()` calls.**Using Unique MACs on Arduino Ethernet Shields**: Multiple Arduino boards with the default MAC address cause network conflicts. Always change the MAC address: `byte mac[] = { 0xDE, 0xAD, 0xBE, 0xEF, 0xFE, 0xED };` (modify the last bytes).**Missing API Error Handling**: Your API should return proper HTTP status codes: 200 (OK), 400 (Bad Request for missing fields), 500 (Server Error). Validate all inputs before inserting into the database.**Not Using F() Macro on Arduino**: String literals consume precious RAM on Arduino. Use `F("string")` to store them in flash memory instead.:::## Quick Reference### Key SQL Patterns```sql-- Latest reading per deviceSELECT*FROM sensor_readingsWHERE device_id =1ORDERBYtimestampDESCLIMIT1;-- Hourly averagesSELECT strftime('%Y-%m-%d %H', timestamp) AShour,AVG(temperature) AS avg_temp,COUNT(*) AS num_readingsFROM sensor_readingsWHERE device_id =1ANDtimestamp>=datetime('now', '-24 hours')GROUPBYhour;-- Anomaly detection (values > 2σ from mean)SELECT*FROM sensor_readingsWHERE temperature > (SELECTAVG(temperature) +2*STDEV(temperature)FROM sensor_readings);```### Flask API Endpoints| Method | Endpoint | Purpose | Example ||--------|----------|---------|---------|| POST | `/api/reading` | Insert single reading | `?device_id=1&temperature=22.5&humidity=65` || GET | `/api/readings/<id>` | Get recent readings | `/api/readings/1?limit=100` || GET | `/api/stats/<id>` | Get aggregated stats | `/api/stats/1?period=hourly` |### Arduino HTTP Request Format```cppclient.print(F("GET /api/reading?device_id="));client.print(DEVICE_ID);client.print(F("&temperature="));client.print(temperature,1);// 1 decimal placeclient.print(F("&humidity="));client.print(humidity,1);client.println(F(" HTTP/1.1"));client.print(F("Host: "));client.println(server);client.println(F("Connection: close"));client.println();// Blank line ends headers```### Storage Trade-offs| Approach | Latency | Offline Support | Capacity | Query Power | Cost | Privacy ||----------|---------|-----------------|----------|-------------|------|---------|| **Edge-Only** (SQLite on Pi) | Low (ms) | Excellent | Limited (GB) | Moderate | Low | Excellent || **Cloud-Only** (MySQL on server) | High (100+ ms) | None | Large (TB) | High | Ongoing | Poor || **Hybrid** (Edge + cloud sync) | Low | Good | Large | High | Moderate | Good |**When to Use Edge-First Storage:**- Real-time control systems (latency critical)- Privacy-sensitive applications (medical, personal data)- Unreliable network connectivity (remote locations)- Bandwidth-constrained deployments**Link to Related Simulation:**Explore database query patterns and performance interactively with our [SQL Query Visualizer](../simulations/sql-query-viz.qmd).---::: {.callout-tip}## Related Concepts in PDF Chapter 13- Section 13.2: Database schema design with ERD diagrams- Section 13.3: Single vs batch insert performance benchmarks- Section 13.4: SQL aggregation patterns for time-series data- Section 13.5: Flask API implementation details- Section 13.6: Arduino Ethernet Shield configuration:::## Self-Assessment CheckpointsTest your understanding before proceeding to the exercises.::: {.callout-note collapse="true" title="Question 1: Write a SQL query to find the average temperature per device for the last 24 hours."}**Answer:**```sqlSELECT device_id,AVG(temperature) AS avg_temp,COUNT(*) AS num_readingsFROM sensor_readingsWHEREtimestamp>=datetime('now', '-24 hours')GROUPBY device_id;```This uses `datetime('now', '-24 hours')` for the time window, `GROUP BY device_id` to aggregate per device, and `AVG(temperature)` to compute the mean. Adding `COUNT(*)` shows how many readings contributed to each average. For proper performance with millions of rows, ensure you have an index: `CREATE INDEX idx_device_time ON sensor_readings(device_id, timestamp);`:::::: {.callout-note collapse="true" title="Question 2: Your database has 1 million rows. Queries take 30 seconds without an index but 20ms with an index. Explain why."}**Answer:** Without an index, the database performs a full table scan checking every row sequentially (O(n) complexity). For 1 million rows, this means 1 million comparisons. With an index on `(device_id, timestamp)`, the database uses a B-tree structure to jump directly to relevant rows (O(log n) complexity). For 1 million rows, this requires only ~20 comparisons (log₂(1,000,000) ≈ 20). The trade-off: indexes speed up SELECT queries but slow down INSERT operations because the index must be updated. For IoT data with high write rates, carefully choose which columns to index—typically device_id and timestamp.:::::: {.callout-note collapse="true" title="Question 3: Compare single inserts vs batch inserts for 1000 sensor readings. Which is faster and why?"}**Answer:** Batch inserts are 10-100× faster. Single inserts: Each INSERT commits a transaction with full ACID guarantees (disk sync, lock acquisition, index update). For 1000 inserts, this means 1000 disk syncs = seconds. Batch inserts using `executemany()`: All 1000 rows inserted in ONE transaction with ONE disk sync = milliseconds. Example code:```python# Slow (1000 transactions)for reading in readings: cursor.execute("INSERT INTO readings VALUES (?, ?, ?)", reading)# Fast (1 transaction)cursor.executemany("INSERT INTO readings VALUES (?, ?, ?)", readings)```For edge gateways buffering data from sensors, batch inserts are essential for acceptable performance.:::::: {.callout-note collapse="true" title="Question 4: Your Arduino sends HTTP requests at 1 Hz to your Flask API. After 1 hour, the database has only 1800 rows instead of 3600. What could be wrong?"}**Answer:** Network failures, API errors, or missing error handling are likely causes. Debugging steps: (1) **Check Arduino serial output** for HTTP response codes—are you seeing 200 OK or 500 errors? (2) **Check Flask logs** for error messages or missing requests, (3) **Add retry logic** with exponential backoff in Arduino code, (4) **Verify timestamp mismatches**—if your SQL query filters by timestamp but Arduino sends Unix epoch while DB expects ISO format, rows might be inserted but not queried correctly, (5) **Test network reliability**—WiFi dropouts cause silent failures. Solution: Buffer readings on Arduino (SD card or EEPROM) and replay during network recovery.:::::: {.callout-note collapse="true" title="Question 5: When should you use edge-first storage (Raspberry Pi + SQLite) versus cloud-only storage (AWS RDS)?"}**Answer:** **Use edge-first when**: (1) Latency is critical (<10ms queries for real-time control), (2) Privacy/compliance requires data stay local (HIPAA, GDPR), (3) Network is unreliable (remote locations, mobile deployments), (4) Bandwidth costs are high or limited. **Use cloud-only when**: (1) Need centralized multi-device queries and analytics, (2) Data volume exceeds edge storage (TB+), (3) Guaranteed reliable internet, (4) Want managed backups and scaling. **Hybrid approach (best for IoT)**: Store recent data (1-7 days) on edge for low-latency access, sync historical data to cloud for long-term analytics. This balances latency, reliability, and capacity.:::## Distributed Systems PatternsThe following sections demonstrate essential distributed systems patterns for edge analytics, building on the database and API foundations covered earlier.### MQTT Message Queue ExampleMQTT (Message Queue Telemetry Transport) provides lightweight publish/subscribe messaging ideal for distributed IoT systems. Unlike HTTP's request/response model, MQTT enables asynchronous communication where edge devices publish sensor data to topics and cloud services subscribe to receive updates.::: {.callout-note icon=false}## Why MQTT for Edge Devices?- **Low overhead**: 2-byte headers vs 200+ bytes for HTTP- **Persistent connections**: Avoids repeated TCP handshakes- **Quality of Service**: QoS 0 (best effort), QoS 1 (at-least-once), QoS 2 (exactly-once)- **Last Will Testament**: Automatic notification if device disconnects unexpectedly- **Battery-friendly**: Reduces power consumption for wireless sensors:::#### Python MQTT Publisher (Edge Device)This example simulates a temperature sensor publishing readings to an MQTT broker:```pythonimport paho.mqtt.client as mqttimport timeimport randomimport json# MQTT ConfigurationBROKER ="localhost"# Use "test.mosquitto.org" for public brokerPORT =1883TOPIC ="sensors/temperature/room1"CLIENT_ID =f"edge-sensor-{random.randint(1000, 9999)}"# Callback when connection succeedsdef on_connect(client, userdata, flags, rc):if rc ==0:print(f"Connected to MQTT broker at {BROKER}")else:print(f"Connection failed with code {rc}")# Callback when message is publisheddef on_publish(client, userdata, mid):print(f"Message {mid} published")# Initialize MQTT clientclient = mqtt.Client(CLIENT_ID)client.on_connect = on_connectclient.on_publish = on_publishtry:# Connect to broker client.connect(BROKER, PORT, keepalive=60) client.loop_start() # Start background thread for network loop# Publish sensor readings every 5 secondsfor i inrange(20):# Simulate temperature reading with drift temperature =20.0+ random.gauss(0, 2.0) # Mean 20°C, std 2°C humidity =50.0+ random.gauss(0, 10.0)# Create JSON payload payload = {"device_id": "sensor_room1","timestamp": time.time(),"temperature": round(temperature, 2),"humidity": round(humidity, 2) }# Publish with QoS 1 (at-least-once delivery) result = client.publish(TOPIC, json.dumps(payload), qos=1)if result.rc == mqtt.MQTT_ERR_SUCCESS:print(f"Published: {payload}")else:print(f"Publish failed: {result.rc}") time.sleep(5)exceptKeyboardInterrupt:print("Interrupted by user")finally: client.loop_stop() client.disconnect()print("Disconnected from MQTT broker")```#### Python MQTT Subscriber (Cloud Service)This subscriber receives sensor data and stores it in a database:```pythonimport paho.mqtt.client as mqttimport jsonimport sqlite3from datetime import datetimeBROKER ="localhost"PORT =1883TOPIC ="sensors/temperature/#"# Wildcard: subscribe to all temperature topicsCLIENT_ID ="cloud-aggregator"# Initialize databaseconn = sqlite3.connect("mqtt_data.db")cursor = conn.cursor()cursor.execute(""" CREATE TABLE IF NOT EXISTS sensor_readings ( id INTEGER PRIMARY KEY AUTOINCREMENT, device_id TEXT, timestamp REAL, temperature REAL, humidity REAL, received_at TEXT )""")conn.commit()def on_connect(client, userdata, flags, rc):if rc ==0:print(f"Subscriber connected to {BROKER}") client.subscribe(TOPIC)print(f"Subscribed to topic: {TOPIC}")else:print(f"Connection failed: {rc}")def on_message(client, userdata, msg):"""Handle incoming MQTT messages"""try:# Parse JSON payload payload = json.loads(msg.payload.decode()) device_id = payload["device_id"] timestamp = payload["timestamp"] temperature = payload["temperature"] humidity = payload["humidity"]# Insert into database cursor.execute(""" INSERT INTO sensor_readings (device_id, timestamp, temperature, humidity, received_at) VALUES (?, ?, ?, ?, ?) """, (device_id, timestamp, temperature, humidity, datetime.now().isoformat())) conn.commit()print(f"Stored: {device_id} | Temp: {temperature}°C | Humidity: {humidity}%")# Check for anomaliesif temperature >30or temperature <10:print(f"⚠️ ALERT: Abnormal temperature detected: {temperature}°C")exceptExceptionas e:print(f"Error processing message: {e}")# Initialize subscriberclient = mqtt.Client(CLIENT_ID)client.on_connect = on_connectclient.on_message = on_messagetry: client.connect(BROKER, PORT, keepalive=60)print("MQTT Subscriber running. Press Ctrl+C to stop.") client.loop_forever() # Blocking call that processes network trafficexceptKeyboardInterrupt:print("\nShutting down subscriber...")finally: conn.close() client.disconnect()```::: {.callout-tip}## MQTT Best Practices for Edge1. **Use unique client IDs**: Generate from device MAC address or UUID to prevent conflicts2. **Set appropriate QoS**: Use QoS 0 for non-critical telemetry, QoS 1 for important data3. **Implement reconnection logic**: Handle broker failures with exponential backoff4. **Use Last Will**: Set `client.will_set()` to notify subscribers if device crashes5. **Optimize topic structure**: Use hierarchy like `building/floor/room/sensor_type`6. **Secure with TLS**: Use port 8883 with certificates for production deployments:::### Distributed Inference CoordinatorIn multi-device edge deployments, a coordinator pattern distributes inference tasks across multiple edge nodes. This example shows a simple round-robin coordinator that balances workload.```pythonimport timeimport threadingimport queuefrom dataclasses import dataclassfrom typing import List, Dictfrom enum import Enumclass NodeStatus(Enum): IDLE ="idle" BUSY ="busy" OFFLINE ="offline"@dataclassclass EdgeNode:"""Represents an edge device capable of running inference""" node_id: str ip_address: str model_type: str# e.g., "image_classification", "object_detection" status: NodeStatus = NodeStatus.IDLE last_heartbeat: float=0.0 tasks_completed: int=0def is_alive(self, timeout=30):"""Check if node has sent heartbeat within timeout"""return (time.time() -self.last_heartbeat) < timeoutclass InferenceCoordinator:"""Coordinates inference tasks across multiple edge nodes"""def__init__(self):self.nodes: Dict[str, EdgeNode] = {}self.task_queue = queue.Queue()self.results_queue = queue.Queue()self.next_node_idx =0# For round-robin schedulingself.lock = threading.Lock()def register_node(self, node: EdgeNode):"""Register a new edge node with the coordinator"""withself.lock:self.nodes[node.node_id] = node node.last_heartbeat = time.time()print(f"✓ Registered node: {node.node_id} ({node.model_type})")def update_heartbeat(self, node_id: str):"""Update node's last seen timestamp"""withself.lock:if node_id inself.nodes:self.nodes[node_id].last_heartbeat = time.time()self.nodes[node_id].status = NodeStatus.IDLEdef get_available_nodes(self, model_type: str=None) -> List[EdgeNode]:"""Get list of available nodes, optionally filtered by model type""" available = []withself.lock:for node inself.nodes.values():if node.is_alive() and node.status == NodeStatus.IDLE:if model_type isNoneor node.model_type == model_type: available.append(node)return availabledef assign_task(self, task_data: dict) ->str:""" Assign inference task to next available node (round-robin). Returns assigned node_id or None if no nodes available. """ model_type = task_data.get("model_type") available =self.get_available_nodes(model_type)ifnot available:print(f"⚠️ No available nodes for model type: {model_type}")returnNone# Round-robin selectionwithself.lock: node = available[self.next_node_idx %len(available)]self.next_node_idx +=1 node.status = NodeStatus.BUSYprint(f"→ Assigned task to {node.node_id}: {task_data['task_id']}")# In real implementation, send task via HTTP/MQTT to node.ip_addressreturn node.node_iddef complete_task(self, node_id: str, task_id: str, result: dict):"""Mark task as completed and store result"""withself.lock:if node_id inself.nodes: node =self.nodes[node_id] node.status = NodeStatus.IDLE node.tasks_completed +=1 result["node_id"] = node_id result["task_id"] = task_idself.results_queue.put(result)print(f"✓ Task {task_id} completed by {node_id}")def get_cluster_stats(self) ->dict:"""Get statistics about the edge cluster"""withself.lock: total =len(self.nodes) alive =sum(1for n inself.nodes.values() if n.is_alive()) idle =sum(1for n inself.nodes.values()if n.is_alive() and n.status == NodeStatus.IDLE) busy =sum(1for n inself.nodes.values()if n.is_alive() and n.status == NodeStatus.BUSY) total_tasks =sum(n.tasks_completed for n inself.nodes.values())return {"total_nodes": total,"alive_nodes": alive,"idle_nodes": idle,"busy_nodes": busy,"total_tasks_completed": total_tasks }def health_check_loop(self, interval=10):"""Periodically check node health (run in background thread)"""whileTrue: time.sleep(interval)withself.lock:for node inself.nodes.values():ifnot node.is_alive():if node.status != NodeStatus.OFFLINE:print(f"⚠️ Node {node.node_id} went offline") node.status = NodeStatus.OFFLINE# Example usageif__name__=="__main__": coordinator = InferenceCoordinator()# Register edge nodes coordinator.register_node(EdgeNode("edge-pi-01", "192.168.1.101", "image_classification")) coordinator.register_node(EdgeNode("edge-pi-02", "192.168.1.102", "image_classification")) coordinator.register_node(EdgeNode("edge-jetson-01", "192.168.1.103", "object_detection"))# Start health check in background health_thread = threading.Thread(target=coordinator.health_check_loop, daemon=True) health_thread.start()# Simulate task assignmentfor i inrange(5): task = {"task_id": f"task_{i:03d}","model_type": "image_classification","image_path": f"/data/image_{i}.jpg" } node_id = coordinator.assign_task(task)if node_id:# Simulate task completion after 2 seconds time.sleep(2) coordinator.complete_task(node_id, task["task_id"], {"prediction": "cat", "confidence": 0.95})# Print cluster statistics stats = coordinator.get_cluster_stats()print(f"\nCluster Stats: {stats}")```::: {.callout-warning}## Coordinator Pitfalls**Single Point of Failure**: If the coordinator crashes, the entire cluster becomes unresponsive. Solution: Implement leader election with multiple coordinator replicas (use Raft or Paxos consensus).**Task Queue Overflow**: If tasks arrive faster than nodes can process, the queue grows unbounded. Solution: Set max queue size and reject new tasks when full, or use priority queues.**Stale Node State**: Network delays can cause outdated status information. Solution: Use pessimistic locking (assume busy until confirmed) and timeout-based state transitions.:::### Edge Synchronization ExampleEdge devices often need to synchronize state or share data with peers. This example demonstrates eventual consistency with conflict resolution.```pythonimport timeimport hashlibimport jsonfrom typing import Dict, Any, Tuplefrom dataclasses import dataclass, fieldfrom datetime import datetime@dataclassclass VersionedValue:"""Value with vector clock for tracking causality""" value: Any timestamp: float node_id: str version: int=1def to_dict(self):return {"value": self.value,"timestamp": self.timestamp,"node_id": self.node_id,"version": self.version }class EdgeDataStore:""" Distributed key-value store with eventual consistency. Uses last-write-wins conflict resolution. """def__init__(self, node_id: str):self.node_id = node_idself.data: Dict[str, VersionedValue] = {}self.sync_log = [] # Track synchronization eventsdef put(self, key: str, value: Any) ->None:"""Store a value locally with version metadata"""if key inself.data:# Increment version for updates old_version =self.data[key].version new_version = old_version +1else: new_version =1 versioned = VersionedValue( value=value, timestamp=time.time(), node_id=self.node_id, version=new_version )self.data[key] = versionedprint(f"[{self.node_id}] PUT {key} = {value} (v{new_version})")def get(self, key: str) -> Any:"""Retrieve a value"""if key inself.data:returnself.data[key].valuereturnNonedef get_versioned(self, key: str) -> VersionedValue:"""Get value with metadata"""returnself.data.get(key)def sync_with_peer(self, peer_store: 'EdgeDataStore') -> Tuple[int, int, int]:""" Synchronize data with another edge node. Returns (keys_sent, keys_received, conflicts_resolved) """ keys_sent =0 keys_received =0 conflicts =0# Get all keys from both stores all_keys =set(self.data.keys()) |set(peer_store.data.keys())for key in all_keys: local_val =self.get_versioned(key) peer_val = peer_store.get_versioned(key)# Case 1: Key only exists locally - send to peerif peer_val isNone: peer_store.data[key] = local_val keys_sent +=1print(f" → Sent {key} to {peer_store.node_id}")# Case 2: Key only exists on peer - receive from peerelif local_val isNone:self.data[key] = peer_val keys_received +=1print(f" ← Received {key} from {peer_store.node_id}")# Case 3: Key exists on both - resolve conflictelse: winner =self._resolve_conflict(key, local_val, peer_val)if winner != local_val:self.data[key] = winner conflicts +=1print(f" ⚡ Conflict on {key}: chose {winner.node_id}'s version")if winner != peer_val: peer_store.data[key] = winnerself.sync_log.append({"timestamp": time.time(),"peer": peer_store.node_id,"sent": keys_sent,"received": keys_received,"conflicts": conflicts })return (keys_sent, keys_received, conflicts)def _resolve_conflict(self, key: str, val1: VersionedValue, val2: VersionedValue) -> VersionedValue:""" Resolve conflicts using Last-Write-Wins (LWW) strategy. Fallback to node_id comparison for ties. """# Compare timestamps (last write wins)if val1.timestamp != val2.timestamp:return val1 if val1.timestamp > val2.timestamp else val2# Timestamps equal - use node_id as tiebreakerreturn val1 if val1.node_id > val2.node_id else val2def get_checksum(self) ->str:"""Compute checksum of entire datastore for verification""" content = json.dumps({k: v.to_dict() for k, v insorted(self.data.items())})return hashlib.md5(content.encode()).hexdigest()# Example usage: Multi-node edge synchronizationif__name__=="__main__":# Create three edge nodes node_a = EdgeDataStore("edge-node-A") node_b = EdgeDataStore("edge-node-B") node_c = EdgeDataStore("edge-node-C")print("=== Initial State ===")# Each node collects different sensor data node_a.put("temperature", 22.5) node_a.put("humidity", 60) node_b.put("temperature", 23.0) # Slightly different reading node_b.put("pressure", 1013) node_c.put("light_level", 450) time.sleep(1) # Simulate time passingprint("\n=== Synchronization Round 1: A ↔ B ===") sent, recv, conflicts = node_a.sync_with_peer(node_b)print(f"Summary: sent={sent}, received={recv}, conflicts={conflicts}")print("\n=== Synchronization Round 2: B ↔ C ===") sent, recv, conflicts = node_b.sync_with_peer(node_c)print(f"Summary: sent={sent}, received={recv}, conflicts={conflicts}")print("\n=== Synchronization Round 3: A ↔ C ===") sent, recv, conflicts = node_a.sync_with_peer(node_c)print(f"Summary: sent={sent}, received={recv}, conflicts={conflicts}")print("\n=== Final State ===")for node in [node_a, node_b, node_c]:print(f"{node.node_id}: {list(node.data.keys())} | Checksum: {node.get_checksum()[:8]}")# Verify eventual consistencyif node_a.get_checksum() == node_b.get_checksum() == node_c.get_checksum():print("✓ All nodes converged to same state (eventual consistency achieved)")else:print("✗ Nodes have different states - consistency not achieved")```::: {.callout-tip}## Synchronization Strategies**Last-Write-Wins (LWW)**: Simple but can lose data. Good for sensor readings where latest value matters.**Vector Clocks**: Track causality across nodes. Detects concurrent writes but requires more metadata.**CRDTs (Conflict-Free Replicated Data Types)**: Guarantee convergence without coordination. Use for counters, sets, or registers.**Application-Level Merge**: Custom conflict resolution based on domain logic (e.g., take max temperature, merge alert lists).:::### CAP Theorem DemonstrationThe CAP theorem states distributed systems can provide only 2 of 3 guarantees: Consistency, Availability, Partition tolerance. This example demonstrates trade-offs.```pythonimport timeimport randomimport threadingfrom enum import Enumfrom typing import Optional, Listclass ConsistencyModel(Enum): STRONG ="strong"# CP: Consistent + Partition-tolerant EVENTUAL ="eventual"# AP: Available + Partition-tolerantclass Node:"""Represents a distributed database node"""def__init__(self, node_id: str, consistency: ConsistencyModel):self.node_id = node_idself.consistency = consistencyself.data = {}self.is_partitioned =False# Simulates network partitionself.connected_nodes: List['Node'] = []self.lock = threading.Lock()self.write_count =0self.read_count =0def connect_to(self, other_node: 'Node'):"""Establish bidirectional connection"""if other_node notinself.connected_nodes:self.connected_nodes.append(other_node) other_node.connected_nodes.append(self)def partition(self):"""Simulate network partition"""self.is_partitioned =Trueprint(f"⚠️ {self.node_id} is now partitioned from the network")def heal(self):"""Restore network connectivity"""self.is_partitioned =Falseprint(f"✓ {self.node_id} network partition healed")def write(self, key: str, value: any, timeout: float=2.0) ->bool:""" Write data with consistency guarantees. Returns True if write succeeds, False otherwise. """ start_time = time.time()ifself.consistency == ConsistencyModel.STRONG:returnself._strong_consistency_write(key, value, timeout)else:returnself._eventual_consistency_write(key, value, timeout)def _strong_consistency_write(self, key: str, value: any, timeout: float) ->bool:""" CP System: Require majority quorum before write succeeds. Sacrifices availability during partitions. """# Count reachable nodes (including self) reachable = [self] + [n for n inself.connected_nodes ifnot n.is_partitioned] total_nodes =len(self.connected_nodes) +1 quorum_size = (total_nodes //2) +1# Majorityiflen(reachable) < quorum_size:print(f"✗ {self.node_id}: WRITE REJECTED (no quorum: {len(reachable)}/{quorum_size})")returnFalse# Write to all reachable nodeswithself.lock:self.data[key] = valueself.write_count +=1for node in reachable:if node !=self:with node.lock: node.data[key] = valueprint(f"✓ {self.node_id}: WRITE COMMITTED {key}={value} (quorum: {len(reachable)}/{total_nodes})")returnTruedef _eventual_consistency_write(self, key: str, value: any, timeout: float) ->bool:""" AP System: Always accept writes locally. Sacrifices consistency - eventual convergence when partition heals. """withself.lock:self.data[key] = valueself.write_count +=1print(f"✓ {self.node_id}: WRITE ACCEPTED {key}={value} (local only)")# Async replication to reachable nodes (fire-and-forget)def replicate():for node inself.connected_nodes:ifnot node.is_partitioned:with node.lock: node.data[key] = value threading.Thread(target=replicate, daemon=True).start()returnTruedef read(self, key: str) -> Optional[any]:"""Read data from local node"""withself.lock:self.read_count +=1 value =self.data.get(key)print(f" {self.node_id}: READ {key} → {value}")return valuedef get_stats(self) ->dict:"""Return node statistics"""return {"node_id": self.node_id,"consistency": self.consistency.value,"partitioned": self.is_partitioned,"keys": len(self.data),"writes": self.write_count,"reads": self.read_count }# Demonstrationdef demonstrate_cap_theorem():print("="*60)print("CAP THEOREM DEMONSTRATION")print("="*60)# Scenario 1: CP System (Strong Consistency)print("\n### Scenario 1: CP System (Strong Consistency) ###\n") node1_cp = Node("Node1-CP", ConsistencyModel.STRONG) node2_cp = Node("Node2-CP", ConsistencyModel.STRONG) node3_cp = Node("Node3-CP", ConsistencyModel.STRONG) node1_cp.connect_to(node2_cp) node1_cp.connect_to(node3_cp) node2_cp.connect_to(node3_cp)# All nodes healthy - writes succeedprint("1. All nodes healthy:") node1_cp.write("temperature", 22.5)# Partition node3 - still have quorum (2/3)print("\n2. Partition one node (quorum maintained):") node3_cp.partition() node1_cp.write("temperature", 23.0)# Partition node2 - lose quorum (1/3)print("\n3. Partition second node (quorum lost):") node2_cp.partition() success = node1_cp.write("temperature", 24.0)print(f"\n→ CP System: Chose CONSISTENCY over AVAILABILITY")print(f" During partition, writes are rejected to prevent inconsistency")# Scenario 2: AP System (Eventual Consistency)print("\n"+"="*60)print("### Scenario 2: AP System (Eventual Consistency) ###\n") node1_ap = Node("Node1-AP", ConsistencyModel.EVENTUAL) node2_ap = Node("Node2-AP", ConsistencyModel.EVENTUAL) node3_ap = Node("Node3-AP", ConsistencyModel.EVENTUAL) node1_ap.connect_to(node2_ap) node1_ap.connect_to(node3_ap) node2_ap.connect_to(node3_ap)# All nodes healthyprint("1. All nodes healthy:") node1_ap.write("temperature", 22.5) time.sleep(0.1) # Allow replication# Partition nodes - writes still acceptedprint("\n2. Partition two nodes (create split-brain):") node2_ap.partition() node3_ap.partition() node1_ap.write("temperature", 23.0) # Write to node1 time.sleep(0.1) node2_ap.write("temperature", 25.5) # Concurrent write to node2!print("\n3. Read from different nodes (inconsistent):") node1_ap.read("temperature") node2_ap.read("temperature")# Heal partition - eventual consistencyprint("\n4. Heal partition (eventual convergence):") node2_ap.heal() node3_ap.heal() time.sleep(0.2) # Allow syncprint(f"\n→ AP System: Chose AVAILABILITY over CONSISTENCY")print(f" During partition, writes accepted but data temporarily inconsistent")print(f" System eventually converges when partition heals")# Summaryprint("\n"+"="*60)print("SUMMARY: CAP THEOREM TRADE-OFFS")print("="*60)print("\nCP System (Strong Consistency):")print(" ✓ Always consistent reads")print(" ✓ No split-brain scenarios")print(" ✗ Unavailable during partitions")print(" Use case: Banking, inventory, critical IoT control")print("\nAP System (Eventual Consistency):")print(" ✓ Always available for reads/writes")print(" ✓ Resilient to network failures")print(" ✗ Temporary inconsistencies")print(" Use case: Sensor telemetry, social media, caching")print("\n"+"="*60)if__name__=="__main__": demonstrate_cap_theorem()```::: {.callout-note icon=false}## CAP Theorem for Edge Analytics**Consistency (C)**: All nodes see the same data at the same time- Example: All edge devices report identical model version- Requires: Coordination, quorum, locks**Availability (A)**: Every request receives a response (success or failure)- Example: Sensor readings always accepted, even during network outage- Requires: Local processing, asynchronous replication**Partition Tolerance (P)**: System continues operating despite network failures- Example: Edge devices work when cloud connection drops- Requires: Distributed architecture (unavoidable in edge systems)**Edge systems typically choose AP**: Edge devices must continue operating during network outages, accepting temporary inconsistencies. Synchronization happens when connectivity is restored.:::::: {.callout-tip}## Choosing Your CAP Priorities**Choose CP (Consistency + Partition Tolerance)** when:- Data correctness is critical (financial transactions, medical records)- Stale data is dangerous (actuator commands, safety systems)- Acceptable to block operations during failures- Example: Distributed locking for actuator control**Choose AP (Availability + Partition Tolerance)** when:- System must always respond (sensor data collection, monitoring)- Temporary staleness is acceptable (cached predictions, telemetry)- Read-heavy workloads with infrequent conflicts- Example: Multi-sensor aggregation, edge analytics dashboards**Hybrid Approach** (common in edge systems):- Critical control path: CP (actuators, safety)- Telemetry and monitoring: AP (sensors, logs)- Use application-specific conflict resolution:::### Practical Exercises::: {.callout-note collapse="true" title="Exercise 1: Extend MQTT subscriber to detect sensor failures"}**Challenge**: Modify the MQTT subscriber to detect when a sensor stops publishing (hasn't sent data in 60 seconds) and send an alert.**Hints**:- Track last seen timestamp per device_id- Use a background thread that checks timestamps every 30 seconds- Publish alerts to a separate topic: `alerts/sensor_offline`**Solution approach**:```pythondevice_last_seen = {}TIMEOUT =60def check_timeouts():whileTrue: time.sleep(30) current_time = time.time()for device_id, last_seen in device_last_seen.items():if current_time - last_seen > TIMEOUT: alert = {"device_id": device_id, "status": "offline","last_seen": last_seen} client.publish("alerts/sensor_offline", json.dumps(alert))```:::::: {.callout-note collapse="true" title="Exercise 2: Implement priority-based task scheduling in coordinator"}**Challenge**: Extend the InferenceCoordinator to support task priorities (HIGH, MEDIUM, LOW). High-priority tasks should be assigned before low-priority ones.**Hints**:- Use `queue.PriorityQueue` instead of regular queue- Store tasks as tuples: `(priority, timestamp, task_data)`- Lower priority number = higher priority (HIGH=0, MEDIUM=1, LOW=2)**Solution approach**:```pythonfrom queue import PriorityQueueclass Priority(Enum): HIGH =0 MEDIUM =1 LOW =2task_queue = PriorityQueue()task_queue.put((Priority.HIGH.value, time.time(), task_data))priority, timestamp, task = task_queue.get() # Gets highest priority first```:::::: {.callout-note collapse="true" title="Exercise 3: Add vector clocks to edge synchronization">**Challenge**: Replace timestamp-based conflict resolution with vector clocks to detect concurrent writes.**Hints**:- Vector clock is a dict mapping node_id → version number- Increment own version on each write- Merge by taking max of each node's version- Concurrent if neither vector dominates the other**Solution approach**:```python@dataclassclass VectorClock: clocks: Dict[str, int] = field(default_factory=dict)def increment(self, node_id: str):self.clocks[node_id] =self.clocks.get(node_id, 0) +1def dominates(self, other: 'VectorClock') ->bool:"""Returns True if self is strictly newer than other""" has_greater =Falsefor node_id inset(self.clocks.keys()) |set(other.clocks.keys()):ifself.clocks.get(node_id, 0) < other.clocks.get(node_id, 0):returnFalseifself.clocks.get(node_id, 0) > other.clocks.get(node_id, 0): has_greater =Truereturn has_greater```:::## Try It Yourself: Executable Python ExamplesThe following code blocks demonstrate distributed data management patterns for edge analytics. All examples are self-contained and runnable.### 1. SQLite Database OperationsComprehensive SQLite operations for IoT sensor data:```{python}import sqlite3import numpy as npimport pandas as pdimport matplotlib.pyplot as pltfrom datetime import datetime, timedeltaimport time# Create in-memory database for demonstrationprint("=== Setting Up SQLite Database ===\n")conn = sqlite3.connect(':memory:') # Use ':memory:' for demo, or 'sensors.db' for persistentcursor = conn.cursor()# Create devices tablecursor.execute(""" CREATE TABLE devices ( device_id INTEGER PRIMARY KEY, name TEXT NOT NULL, type TEXT NOT NULL, location TEXT, installed_date TEXT )""")# Create sensor_readings table with foreign keycursor.execute(""" CREATE TABLE sensor_readings ( reading_id INTEGER PRIMARY KEY AUTOINCREMENT, device_id INTEGER NOT NULL, timestamp TEXT NOT NULL, temperature REAL, humidity REAL, FOREIGN KEY (device_id) REFERENCES devices(device_id) )""")# Create index for fast queriescursor.execute(""" CREATE INDEX idx_device_timestamp ON sensor_readings(device_id, timestamp)""")conn.commit()print("✓ Tables created: devices, sensor_readings")print("✓ Index created on (device_id, timestamp)")# Insert sample devicesdevices_data = [ (1, 'Sensor_Room1', 'DHT22', 'Living Room', '2024-01-01'), (2, 'Sensor_Room2', 'DHT22', 'Bedroom', '2024-01-01'), (3, 'Sensor_Outdoor', 'BME280', 'Garden', '2024-01-15'),]cursor.executemany(""" INSERT INTO devices (device_id, name, type, location, installed_date) VALUES (?, ?, ?, ?, ?)""", devices_data)conn.commit()print(f"✓ Inserted {len(devices_data)} devices")# Generate synthetic sensor dataprint("\n=== Generating Synthetic Sensor Data ===")np.random.seed(42)readings = []base_time = datetime.now() - timedelta(days=7) # Start 7 days agofor device_id in [1, 2, 3]: base_temp =20.0if device_id in [1, 2] else15.0# Indoor vs outdoor base_humidity =50.0for i inrange(1000): # 1000 readings per device timestamp = base_time + timedelta(minutes=i*10) # Every 10 minutes temperature = base_temp + np.random.randn() *2.0# Gaussian noise humidity = base_humidity + np.random.randn() *5.0 readings.append(( device_id, timestamp.isoformat(),round(temperature, 2),round(humidity, 2) ))print(f"Generated {len(readings)} synthetic readings")# Insert readings (single inserts for comparison later)start_time = time.perf_counter()for reading in readings[:100]: # Insert first 100 one by one cursor.execute(""" INSERT INTO sensor_readings (device_id, timestamp, temperature, humidity) VALUES (?, ?, ?, ?) """, reading)conn.commit()single_insert_time = time.perf_counter() - start_timeprint(f"Single inserts (100 rows): {single_insert_time*1000:.1f} ms")# Batch insert remaining datastart_time = time.perf_counter()cursor.executemany(""" INSERT INTO sensor_readings (device_id, timestamp, temperature, humidity) VALUES (?, ?, ?, ?)""", readings[100:])conn.commit()batch_insert_time = time.perf_counter() - start_timeprint(f"Batch insert ({len(readings)-100} rows): {batch_insert_time*1000:.1f} ms")speedup = (single_insert_time *len(readings[100:])/100) / batch_insert_timeprint(f"Batch insert speedup: {speedup:.1f}x faster\n")# Query examplesprint("=== SQL Query Examples ===\n")# 1. Latest reading per deviceprint("1. Latest reading per device:")query1 =""" SELECT d.name, d.location, sr.temperature, sr.humidity, sr.timestamp FROM sensor_readings sr JOIN devices d ON sr.device_id = d.device_id WHERE sr.reading_id IN ( SELECT MAX(reading_id) FROM sensor_readings GROUP BY device_id )"""df_latest = pd.read_sql_query(query1, conn)print(df_latest.to_string(index=False))# 2. Hourly averages for last 24 hoursprint("\n2. Hourly averages (last 24 hours) for Device 1:")query2 =""" SELECT strftime('%Y-%m-%d %H:00', timestamp) AS hour, COUNT(*) AS num_readings, ROUND(AVG(temperature), 2) AS avg_temp, ROUND(AVG(humidity), 2) AS avg_humidity, ROUND(MIN(temperature), 2) AS min_temp, ROUND(MAX(temperature), 2) AS max_temp FROM sensor_readings WHERE device_id = 1 AND timestamp >= datetime('now', '-24 hours') GROUP BY hour ORDER BY hour DESC LIMIT 10"""df_hourly = pd.read_sql_query(query2, conn)print(df_hourly.to_string(index=False))# 3. Anomaly detection (values > 2 std from mean)print("\n3. Anomaly detection (temperature outliers):")query3 =""" WITH stats AS ( SELECT AVG(temperature) AS mean_temp, AVG(temperature * temperature) - AVG(temperature) * AVG(temperature) AS var_temp FROM sensor_readings WHERE device_id = 1 ) SELECT sr.timestamp, sr.temperature, ROUND(s.mean_temp, 2) AS mean, ROUND(SQRT(s.var_temp), 2) AS std_dev, ROUND((sr.temperature - s.mean_temp) / SQRT(s.var_temp), 2) AS z_score FROM sensor_readings sr, stats s WHERE sr.device_id = 1 AND ABS(sr.temperature - s.mean_temp) > 2 * SQRT(s.var_temp) ORDER BY ABS(sr.temperature - s.mean_temp) DESC LIMIT 5"""df_anomalies = pd.read_sql_query(query3, conn)ifnot df_anomalies.empty:print(df_anomalies.to_string(index=False))else:print("No anomalies detected (data within 2σ)")# Visualizationprint("\n=== Visualizing Data ===")# Query all data for Device 1query_viz =""" SELECT timestamp, temperature, humidity FROM sensor_readings WHERE device_id = 1 ORDER BY timestamp"""df_viz = pd.read_sql_query(query_viz, conn)df_viz['timestamp'] = pd.to_datetime(df_viz['timestamp'])fig, (ax1, ax2) = plt.subplots(2, 1, figsize=(14, 8))# Temperature over timeax1.plot(df_viz['timestamp'], df_viz['temperature'], linewidth=1, color='#ff6b6b', alpha=0.7)ax1.axhline(y=df_viz['temperature'].mean(), color='black', linestyle='--', linewidth=2, label=f'Mean: {df_viz["temperature"].mean():.1f}°C')ax1.axhline(y=df_viz['temperature'].mean() +2*df_viz['temperature'].std(), color='orange', linestyle=':', linewidth=1.5, label='±2σ')ax1.axhline(y=df_viz['temperature'].mean() -2*df_viz['temperature'].std(), color='orange', linestyle=':', linewidth=1.5)ax1.set_ylabel('Temperature (°C)', fontsize=11, fontweight='bold')ax1.set_title('Sensor Readings: Device 1 (Living Room)', fontsize=13, fontweight='bold')ax1.legend()ax1.grid(alpha=0.3)# Humidity over timeax2.plot(df_viz['timestamp'], df_viz['humidity'], linewidth=1, color='#45b7d1', alpha=0.7)ax2.axhline(y=df_viz['humidity'].mean(), color='black', linestyle='--', linewidth=2, label=f'Mean: {df_viz["humidity"].mean():.1f}%')ax2.set_xlabel('Time', fontsize=11, fontweight='bold')ax2.set_ylabel('Humidity (%)', fontsize=11, fontweight='bold')ax2.legend()ax2.grid(alpha=0.3)plt.tight_layout()plt.show()# Database statisticscursor.execute("SELECT COUNT(*) FROM devices")num_devices = cursor.fetchone()[0]cursor.execute("SELECT COUNT(*) FROM sensor_readings")num_readings = cursor.fetchone()[0]cursor.execute("SELECT MIN(timestamp), MAX(timestamp) FROM sensor_readings")time_range = cursor.fetchone()print(f"\n=== Database Statistics ===")print(f"Total devices: {num_devices}")print(f"Total readings: {num_readings:,}")print(f"Time range: {time_range[0]} to {time_range[1]}")print(f"Database size (in-memory): ~{num_readings *32/1024:.1f} KB")conn.close()print("\nInsight: Proper indexing and batch inserts are crucial for IoT data performance.")print("SQLite is excellent for edge storage (Raspberry Pi), supporting millions of rows efficiently.")```### 2. Batch vs Single Insert ComparisonBenchmark insert performance for different strategies:```{python}import sqlite3import numpy as npimport timeimport matplotlib.pyplot as pltimport pandas as pddef benchmark_inserts(num_rows, batch_sizes):""" Benchmark different insert strategies. Args: num_rows: Total number of rows to insert batch_sizes: List of batch sizes to test (1 = single inserts) """ results = []for batch_size in batch_sizes:# Create fresh database conn = sqlite3.connect(':memory:') cursor = conn.cursor() cursor.execute(""" CREATE TABLE sensor_readings ( reading_id INTEGER PRIMARY KEY AUTOINCREMENT, device_id INTEGER, timestamp TEXT, temperature REAL, humidity REAL ) """)# Generate data data = [ ( np.random.randint(1, 4), # device_id datetime.now().isoformat(),round(20+ np.random.randn() *2, 2),round(50+ np.random.randn() *5, 2) )for _ inrange(num_rows) ]# Benchmark inserts start_time = time.perf_counter()if batch_size ==1:# Single insertsfor row in data: cursor.execute(""" INSERT INTO sensor_readings (device_id, timestamp, temperature, humidity) VALUES (?, ?, ?, ?) """, row) conn.commit() # Commit each insertelse:# Batch insertsfor i inrange(0, len(data), batch_size): batch = data[i:i+batch_size] cursor.executemany(""" INSERT INTO sensor_readings (device_id, timestamp, temperature, humidity) VALUES (?, ?, ?, ?) """, batch) conn.commit() # Commit each batch elapsed_time = time.perf_counter() - start_time throughput = num_rows / elapsed_time results.append({'Batch Size': batch_size if batch_size >1else'Single','Time (s)': elapsed_time,'Throughput (rows/s)': throughput }) conn.close()print(f"Batch size {batch_size if batch_size >1else'Single':>6}: {elapsed_time:>6.3f}s ({throughput:>8.0f} rows/s)")return resultsprint("=== Batch Insert Performance Benchmark ===\n")print("Testing with 1000 rows...\n")batch_sizes = [1, 10, 50, 100, 200, 500, 1000]results = benchmark_inserts(num_rows=1000, batch_sizes=batch_sizes)# Create results dataframedf_results = pd.DataFrame(results)print("\n"+ df_results.to_string(index=False))# Visualize resultsfig, (ax1, ax2) = plt.subplots(1, 2, figsize=(14, 5))# Time vs batch sizebatch_labels = [str(r['Batch Size']) for r in results]times = [r['Time (s)'] for r in results]ax1.bar(batch_labels, times, color=['#ff6b6b'if b =='Single'else'#45b7d1'for b in batch_labels], edgecolor='black', linewidth=1.5)ax1.set_xlabel('Batch Size', fontsize=11, fontweight='bold')ax1.set_ylabel('Time (seconds)', fontsize=11, fontweight='bold')ax1.set_title('Insert Time vs Batch Size (1000 rows)', fontsize=13, fontweight='bold')ax1.grid(axis='y', alpha=0.3)ax1.tick_params(axis='x', rotation=45)# Throughput vs batch sizethroughputs = [r['Throughput (rows/s)'] for r in results]ax2.plot(range(len(batch_sizes)), throughputs, marker='o', linewidth=2.5, markersize=10, color='#1dd1a1')ax2.set_xticks(range(len(batch_sizes)))ax2.set_xticklabels(batch_labels, rotation=45)ax2.set_xlabel('Batch Size', fontsize=11, fontweight='bold')ax2.set_ylabel('Throughput (rows/second)', fontsize=11, fontweight='bold')ax2.set_title('Insert Throughput vs Batch Size', fontsize=13, fontweight='bold')ax2.grid(alpha=0.3)plt.tight_layout()plt.show()# Calculate speedupsingle_time = results[0]['Time (s)']best_time =min(r['Time (s)'] for r in results[1:])max_speedup = single_time / best_timeprint(f"\n=== Performance Analysis ===")print(f"Single insert time: {single_time:.3f} s")print(f"Best batch time: {best_time:.3f} s")print(f"Maximum speedup: {max_speedup:.1f}x")print(f"\nOptimal batch size for this workload: {results[-2]['Batch Size']} (diminishing returns beyond this)")print("\nInsight: Batch inserts provide 10-100x speedup by reducing transaction overhead.")print("For edge gateways, buffer 10-100 readings before inserting to maximize throughput.")```### 3. REST API SimulationSimulate a Flask-like REST API for sensor data ingestion:```{python}import sqlite3from datetime import datetimeimport jsonimport matplotlib.pyplot as pltimport pandas as pdimport numpy as npclass SensorAPI:"""Simulated REST API for sensor data ingestion"""def__init__(self, db_path=':memory:'):self.conn = sqlite3.connect(db_path)self._init_database()def _init_database(self):"""Initialize database schema""" cursor =self.conn.cursor() cursor.execute(""" CREATE TABLE IF NOT EXISTS devices ( device_id INTEGER PRIMARY KEY, name TEXT NOT NULL, type TEXT NOT NULL, location TEXT ) """) cursor.execute(""" CREATE TABLE IF NOT EXISTS sensor_readings ( reading_id INTEGER PRIMARY KEY AUTOINCREMENT, device_id INTEGER NOT NULL, timestamp TEXT NOT NULL, temperature REAL, humidity REAL, FOREIGN KEY (device_id) REFERENCES devices(device_id) ) """) cursor.execute(""" CREATE INDEX IF NOT EXISTS idx_device_timestamp ON sensor_readings(device_id, timestamp) """)# Insert sample devices cursor.executemany(""" INSERT OR IGNORE INTO devices (device_id, name, type, location) VALUES (?, ?, ?, ?) """, [ (1, 'ESP32_01', 'DHT22', 'Living Room'), (2, 'ESP32_02', 'BME280', 'Kitchen'), (3, 'Arduino_01', 'DHT11', 'Bedroom') ])self.conn.commit()def post_reading(self, device_id, temperature, humidity):""" POST /api/reading - Insert single sensor reading Args: device_id: Device identifier temperature: Temperature in Celsius humidity: Humidity percentage Returns: (status_code, response_json) """# Validate inputifnotisinstance(device_id, int) or device_id <1:return400, {"error": "Invalid device_id"}ifnotisinstance(temperature, (int, float)):return400, {"error": "Invalid temperature"}ifnotisinstance(humidity, (int, float)):return400, {"error": "Invalid humidity"}# Check device exists cursor =self.conn.cursor() cursor.execute("SELECT 1 FROM devices WHERE device_id = ?", (device_id,))ifnot cursor.fetchone():return404, {"error": f"Device {device_id} not found"}# Insert readingtry: timestamp = datetime.now().isoformat() cursor.execute(""" INSERT INTO sensor_readings (device_id, timestamp, temperature, humidity) VALUES (?, ?, ?, ?) """, (device_id, timestamp, temperature, humidity))self.conn.commit() reading_id = cursor.lastrowidreturn200, {"status": "success","reading_id": reading_id,"device_id": device_id,"timestamp": timestamp,"temperature": temperature,"humidity": humidity }exceptExceptionas e:return500, {"error": str(e)}def post_batch_readings(self, readings):""" POST /api/readings/batch - Insert multiple readings Args: readings: List of dicts with keys: device_id, temperature, humidity Returns: (status_code, response_json) """ifnotisinstance(readings, list) orlen(readings) ==0:return400, {"error": "readings must be non-empty list"}try: timestamp = datetime.now().isoformat() data = [ (r['device_id'], timestamp, r['temperature'], r['humidity'])for r in readings ] cursor =self.conn.cursor() cursor.executemany(""" INSERT INTO sensor_readings (device_id, timestamp, temperature, humidity) VALUES (?, ?, ?, ?) """, data)self.conn.commit()return200, {"status": "success","inserted": len(readings),"timestamp": timestamp }exceptExceptionas e:return500, {"error": str(e)}def get_latest_readings(self, device_id, limit=10):""" GET /api/readings/<device_id>?limit=N - Get recent readings Args: device_id: Device identifier limit: Number of readings to return Returns: (status_code, response_json) """ cursor =self.conn.cursor() cursor.execute(""" SELECT reading_id, timestamp, temperature, humidity FROM sensor_readings WHERE device_id = ? ORDER BY timestamp DESC LIMIT ? """, (device_id, limit)) readings = cursor.fetchall()ifnot readings:return404, {"error": f"No readings found for device {device_id}"}return200, {"device_id": device_id,"count": len(readings),"readings": [ {"reading_id": r[0],"timestamp": r[1],"temperature": r[2],"humidity": r[3] }for r in readings ] }def get_statistics(self, device_id):""" GET /api/stats/<device_id> - Get aggregated statistics Args: device_id: Device identifier Returns: (status_code, response_json) """ cursor =self.conn.cursor() cursor.execute(""" SELECT COUNT(*) AS total_readings, MIN(timestamp) AS first_reading, MAX(timestamp) AS last_reading, ROUND(AVG(temperature), 2) AS avg_temp, ROUND(MIN(temperature), 2) AS min_temp, ROUND(MAX(temperature), 2) AS max_temp, ROUND(AVG(humidity), 2) AS avg_humidity FROM sensor_readings WHERE device_id = ? """, (device_id,)) row = cursor.fetchone()if row[0] ==0:return404, {"error": f"No data for device {device_id}"}return200, {"device_id": device_id,"total_readings": row[0],"first_reading": row[1],"last_reading": row[2],"statistics": {"temperature": {"avg": row[3],"min": row[4],"max": row[5] },"humidity": {"avg": row[6] } } }# Demonstrate API usageprint("=== Simulated REST API Demo ===\n")api = SensorAPI()# Test 1: POST single readingprint("1. POST /api/reading - Insert single reading")status, response = api.post_reading(device_id=1, temperature=22.5, humidity=65.0)print(f"Status: {status}")print(f"Response: {json.dumps(response, indent=2)}\n")# Test 2: POST batch readingsprint("2. POST /api/readings/batch - Insert multiple readings")batch_data = [ {"device_id": 1, "temperature": 22.0+ np.random.randn(), "humidity": 65.0+ np.random.randn()*2}for _ inrange(100)]status, response = api.post_batch_readings(batch_data)print(f"Status: {status}")print(f"Response: {json.dumps(response, indent=2)}\n")# Test 3: GET latest readingsprint("3. GET /api/readings/1?limit=5 - Get recent readings")status, response = api.get_latest_readings(device_id=1, limit=5)print(f"Status: {status}")print(f"Response (first 2 readings): {json.dumps(response['readings'][:2], indent=2)}\n")# Test 4: GET statisticsprint("4. GET /api/stats/1 - Get aggregated statistics")status, response = api.get_statistics(device_id=1)print(f"Status: {status}")print(f"Response: {json.dumps(response, indent=2)}\n")# Test 5: Error handling - invalid deviceprint("5. Error handling - POST to non-existent device")status, response = api.post_reading(device_id=999, temperature=20.0, humidity=50.0)print(f"Status: {status}")print(f"Response: {json.dumps(response, indent=2)}\n")# Simulate realistic trafficprint("=== Simulating Realistic API Traffic ===")num_requests =500for device_id in [1, 2, 3]:for _ inrange(num_requests //3): temp =20+ np.random.randn() *2+ (device_id -1) *2 humidity =50+ np.random.randn() *5 api.post_reading(device_id, temp, humidity)print(f"Simulated {num_requests} API requests across 3 devices\n")# Visualize API statisticsprint("=== API Performance Dashboard ===")fig, axes = plt.subplots(2, 2, figsize=(14, 10))# Device 1: Temperature distributionstatus, data1 = api.get_latest_readings(1, limit=1000)temps1 = [r['temperature'] for r in data1['readings']]axes[0, 0].hist(temps1, bins=30, color='#ff6b6b', edgecolor='black', alpha=0.7)axes[0, 0].set_xlabel('Temperature (°C)', fontsize=10)axes[0, 0].set_ylabel('Frequency', fontsize=10)axes[0, 0].set_title('Device 1: Temperature Distribution', fontsize=11, fontweight='bold')axes[0, 0].grid(alpha=0.3)# All devices: Statistics comparisonstats_data = []for device_id in [1, 2, 3]: status, stats = api.get_statistics(device_id) stats_data.append({'Device': f'Device {device_id}','Avg Temp': stats['statistics']['temperature']['avg'],'Min Temp': stats['statistics']['temperature']['min'],'Max Temp': stats['statistics']['temperature']['max'] })df_stats = pd.DataFrame(stats_data)x = np.arange(len(df_stats))width =0.25axes[0, 1].bar(x - width, df_stats['Min Temp'], width, label='Min', color='#45b7d1')axes[0, 1].bar(x, df_stats['Avg Temp'], width, label='Avg', color='#1dd1a1')axes[0, 1].bar(x + width, df_stats['Max Temp'], width, label='Max', color='#ff6b6b')axes[0, 1].set_xlabel('Device', fontsize=10)axes[0, 1].set_ylabel('Temperature (°C)', fontsize=10)axes[0, 1].set_title('Temperature Statistics by Device', fontsize=11, fontweight='bold')axes[0, 1].set_xticks(x)axes[0, 1].set_xticklabels(df_stats['Device'])axes[0, 1].legend()axes[0, 1].grid(axis='y', alpha=0.3)# Reading count per devicereading_counts = []for device_id in [1, 2, 3]: status, stats = api.get_statistics(device_id) reading_counts.append(stats['total_readings'])axes[1, 0].bar([f'Device {i}'for i in [1, 2, 3]], reading_counts, color=['#ff6b6b', '#45b7d1', '#1dd1a1'], edgecolor='black', linewidth=1.5)axes[1, 0].set_ylabel('Total Readings', fontsize=10)axes[1, 0].set_title('Total Readings per Device', fontsize=11, fontweight='bold')axes[1, 0].grid(axis='y', alpha=0.3)# Time series for Device 1status, data1_full = api.get_latest_readings(1, limit=200)temps_series = [r['temperature'] for r inreversed(data1_full['readings'])]axes[1, 1].plot(range(len(temps_series)), temps_series, linewidth=1.5, color='#ff6b6b', alpha=0.7)axes[1, 1].axhline(y=np.mean(temps_series), color='black', linestyle='--', linewidth=2, label=f'Mean: {np.mean(temps_series):.1f}°C')axes[1, 1].set_xlabel('Reading Index', fontsize=10)axes[1, 1].set_ylabel('Temperature (°C)', fontsize=10)axes[1, 1].set_title('Device 1: Temperature Time Series', fontsize=11, fontweight='bold')axes[1, 1].legend()axes[1, 1].grid(alpha=0.3)plt.tight_layout()plt.show()print("\nInsight: REST APIs provide simple HTTP-based data ingestion for edge devices.")print("Key endpoints: POST /api/reading (single), POST /api/readings/batch (bulk), GET /api/readings/<id>")```### 4. Data Aggregation QueriesAdvanced SQL queries for time-series analytics:```{python}import sqlite3import pandas as pdimport numpy as npimport matplotlib.pyplot as pltfrom datetime import datetime, timedelta# Create database with realistic time-series dataprint("=== Creating Time-Series Database ===\n")conn = sqlite3.connect(':memory:')cursor = conn.cursor()# Schemacursor.execute(""" CREATE TABLE sensor_readings ( reading_id INTEGER PRIMARY KEY AUTOINCREMENT, device_id INTEGER, timestamp TEXT, temperature REAL, humidity REAL )""")cursor.execute(""" CREATE INDEX idx_device_timestamp ON sensor_readings(device_id, timestamp)""")# Generate realistic time-series data (30 days, every 5 minutes)np.random.seed(42)readings = []start_time = datetime.now() - timedelta(days=30)for device_id in [1, 2]: base_temp =20.0 temp_trend =0.0# Temperature drift over timefor minute inrange(0, 30*24*60, 5): # Every 5 minutes for 30 days timestamp = start_time + timedelta(minutes=minute)# Add daily cycle (warmer during day, cooler at night) hour = timestamp.hour daily_cycle =3* np.sin((hour -6) * np.pi /12)# Add weekly trend weekly_trend = temp_trend * minute / (30*24*60)# Add noise noise = np.random.randn() *0.5 temperature = base_temp + daily_cycle + weekly_trend + noise humidity =50+ np.random.randn() *5 readings.append((device_id, timestamp.isoformat(), round(temperature, 2), round(humidity, 2)))cursor.executemany(""" INSERT INTO sensor_readings (device_id, timestamp, temperature, humidity) VALUES (?, ?, ?, ?)""", readings)conn.commit()print(f"Generated {len(readings):,} readings over 30 days")print(f"Sampling interval: 5 minutes")print(f"Devices: 2\n")# Query 1: Hourly aggregatesprint("=== Query 1: Hourly Aggregates (Last 48 Hours) ===\n")query1 =""" SELECT strftime('%Y-%m-%d %H:00', timestamp) AS hour, device_id, COUNT(*) AS num_readings, ROUND(AVG(temperature), 2) AS avg_temp, ROUND(MIN(temperature), 2) AS min_temp, ROUND(MAX(temperature), 2) AS max_temp, ROUND(AVG(humidity), 2) AS avg_humidity FROM sensor_readings WHERE timestamp >= datetime('now', '-48 hours') GROUP BY hour, device_id ORDER BY hour DESC, device_id LIMIT 10"""df_hourly = pd.read_sql_query(query1, conn)print(df_hourly.to_string(index=False))# Query 2: Daily aggregates with moving averageprint("\n=== Query 2: Daily Aggregates (Last 7 Days) ===\n")query2 =""" SELECT DATE(timestamp) AS date, device_id, COUNT(*) AS readings, ROUND(AVG(temperature), 2) AS avg_temp, ROUND(MAX(temperature), 2) AS max_temp, ROUND(MIN(temperature), 2) AS min_temp, ROUND(AVG(temperature) - LAG(AVG(temperature), 1, AVG(temperature)) OVER (PARTITION BY device_id ORDER BY DATE(timestamp)), 2) AS temp_change FROM sensor_readings WHERE timestamp >= datetime('now', '-7 days') GROUP BY date, device_id ORDER BY date DESC, device_id"""df_daily = pd.read_sql_query(query2, conn)print(df_daily.to_string(index=False))# Query 3: Peak hours analysisprint("\n=== Query 3: Temperature by Hour of Day (Average over 30 days) ===\n")query3 =""" SELECT CAST(strftime('%H', timestamp) AS INTEGER) AS hour, device_id, COUNT(*) AS samples, ROUND(AVG(temperature), 2) AS avg_temp, ROUND(MIN(temperature), 2) AS min_temp, ROUND(MAX(temperature), 2) AS max_temp FROM sensor_readings GROUP BY hour, device_id ORDER BY hour, device_id"""df_hourly_pattern = pd.read_sql_query(query3, conn)print(df_hourly_pattern.head(12).to_string(index=False))# Query 4: Anomaly detection with z-scoreprint("\n=== Query 4: Temperature Anomalies (|z-score| > 2.5) ===\n")query4 =""" WITH stats AS ( SELECT device_id, AVG(temperature) AS mean_temp, SQRT(AVG(temperature * temperature) - AVG(temperature) * AVG(temperature)) AS std_temp FROM sensor_readings GROUP BY device_id ) SELECT sr.device_id, sr.timestamp, sr.temperature, ROUND(s.mean_temp, 2) AS mean, ROUND(s.std_temp, 2) AS std_dev, ROUND((sr.temperature - s.mean_temp) / s.std_temp, 2) AS z_score FROM sensor_readings sr JOIN stats s ON sr.device_id = s.device_id WHERE ABS((sr.temperature - s.mean_temp) / s.std_temp) > 2.5 ORDER BY ABS(z_score) DESC LIMIT 10"""df_anomalies = pd.read_sql_query(query4, conn)ifnot df_anomalies.empty:print(df_anomalies.to_string(index=False))else:print("No significant anomalies detected")# Query 5: Data quality metricsprint("\n=== Query 5: Data Quality Metrics ===\n")query5 =""" SELECT device_id, COUNT(*) AS total_readings, DATE(MIN(timestamp)) AS first_reading, DATE(MAX(timestamp)) AS last_reading, ROUND(JULIANDAY(MAX(timestamp)) - JULIANDAY(MIN(timestamp)), 1) AS days_active, ROUND(COUNT(*) * 1.0 / (JULIANDAY(MAX(timestamp)) - JULIANDAY(MIN(timestamp)) + 1) / 288, 2) AS completeness FROM sensor_readings GROUP BY device_id"""df_quality = pd.read_sql_query(query5, conn)print(df_quality.to_string(index=False))print("\n(Completeness: 1.0 = 100% of expected readings at 5-minute intervals)")# Visualizationsprint("\n=== Visualization: Time-Series Analysis ===")fig, axes = plt.subplots(2, 2, figsize=(16, 10))# Hourly patterndf_device1_hourly = df_hourly_pattern[df_hourly_pattern['device_id'] ==1]axes[0, 0].plot(df_device1_hourly['hour'], df_device1_hourly['avg_temp'], marker='o', linewidth=2, markersize=6, color='#ff6b6b', label='Device 1')axes[0, 0].fill_between(df_device1_hourly['hour'], df_device1_hourly['min_temp'], df_device1_hourly['max_temp'], alpha=0.3, color='#ff6b6b')axes[0, 0].set_xlabel('Hour of Day', fontsize=11, fontweight='bold')axes[0, 0].set_ylabel('Temperature (°C)', fontsize=11, fontweight='bold')axes[0, 0].set_title('Average Temperature by Hour (30-day average)', fontsize=12, fontweight='bold')axes[0, 0].set_xticks(range(0, 24, 3))axes[0, 0].legend()axes[0, 0].grid(alpha=0.3)# Daily trendquery_daily_full =""" SELECT DATE(timestamp) AS date, AVG(temperature) AS avg_temp FROM sensor_readings WHERE device_id = 1 GROUP BY date ORDER BY date"""df_daily_trend = pd.read_sql_query(query_daily_full, conn)df_daily_trend['date'] = pd.to_datetime(df_daily_trend['date'])axes[0, 1].plot(df_daily_trend['date'], df_daily_trend['avg_temp'], linewidth=2, color='#45b7d1')axes[0, 1].set_xlabel('Date', fontsize=11, fontweight='bold')axes[0, 1].set_ylabel('Avg Temperature (°C)', fontsize=11, fontweight='bold')axes[0, 1].set_title('Daily Average Temperature Trend (30 days)', fontsize=12, fontweight='bold')axes[0, 1].grid(alpha=0.3)axes[0, 1].tick_params(axis='x', rotation=45)# Temperature distributionquery_dist ="SELECT temperature FROM sensor_readings WHERE device_id = 1"df_dist = pd.read_sql_query(query_dist, conn)axes[1, 0].hist(df_dist['temperature'], bins=50, color='#1dd1a1', edgecolor='black', alpha=0.7)axes[1, 0].axvline(df_dist['temperature'].mean(), color='red', linestyle='--', linewidth=2, label=f'Mean: {df_dist["temperature"].mean():.1f}°C')axes[1, 0].axvline(df_dist['temperature'].median(), color='orange', linestyle='--', linewidth=2, label=f'Median: {df_dist["temperature"].median():.1f}°C')axes[1, 0].set_xlabel('Temperature (°C)', fontsize=11, fontweight='bold')axes[1, 0].set_ylabel('Frequency', fontsize=11, fontweight='bold')axes[1, 0].set_title('Temperature Distribution (Device 1, 30 days)', fontsize=12, fontweight='bold')axes[1, 0].legend()axes[1, 0].grid(alpha=0.3)# Comparison: Device 1 vs Device 2query_compare =""" SELECT DATE(timestamp) AS date, device_id, AVG(temperature) AS avg_temp FROM sensor_readings GROUP BY date, device_id ORDER BY date, device_id"""df_compare = pd.read_sql_query(query_compare, conn)df_compare['date'] = pd.to_datetime(df_compare['date'])for device_id, color in [(1, '#ff6b6b'), (2, '#45b7d1')]: df_dev = df_compare[df_compare['device_id'] == device_id] axes[1, 1].plot(df_dev['date'], df_dev['avg_temp'], linewidth=2, label=f'Device {device_id}', color=color)axes[1, 1].set_xlabel('Date', fontsize=11, fontweight='bold')axes[1, 1].set_ylabel('Avg Temperature (°C)', fontsize=11, fontweight='bold')axes[1, 1].set_title('Multi-Device Temperature Comparison', fontsize=12, fontweight='bold')axes[1, 1].legend()axes[1, 1].grid(alpha=0.3)axes[1, 1].tick_params(axis='x', rotation=45)plt.tight_layout()plt.show()conn.close()print("\nInsight: Advanced SQL aggregations enable powerful time-series analytics on edge databases.")print("Key patterns: hourly/daily rollups, moving averages, anomaly detection, data quality metrics.")```## Interactive NotebookThe notebook below contains runnable code for all Level 1 activities.{{< embed ../../notebooks/LAB13_distributed.ipynb >}}## Three-Tier Activities::: {.panel-tabset}### Level 1: NotebookEnvironment: local Jupyter or Colab, no hardware required.Suggested workflow:1. Use the notebook to create the `devices` and `sensor_readings` tables in SQLite.2. Insert synthetic data for 1–3 virtual devices using both single inserts and batch inserts.3. Practice core query patterns: - “latest N readings” per device - hourly/daily aggregates - simple anomaly filters based on thresholds or Z-scores4. Measure and compare the performance of single vs batch inserts (rows per second) using timing code in Python.5. Reflect on how your schema and indexes would behave if you scaled from thousands to millions of rows.### Level 2: SimulatorHere you build and exercise the ingestion API on a laptop or Raspberry Pi, using simulated clients instead of real hardware.Baseline (no Docker required):1. Create `sensors.db` (or a MySQL database) and run the `sensor_api.py` Flask server from the code/notebook.2. Use tools like `curl`, Python `requests`, or a small load-generator script to send HTTP requests that mimic edge devices: - both single-row and batch ingestion - realistic rates (e.g., one reading every 30 seconds per device)3. Inspect database content with SQL queries and confirm that: - schema matches the LaTeX chapter - indexes on `(device_id, timestamp)` are used for your main queries4. Optionally wrap the API and database in Docker containers to simulate deployment on a Pi/edge gateway.Outcome: a working “edge gateway” API that accepts data from simulated devices and stores it reliably.### Level 3: DeviceNow replace the simulated clients with real hardware.1. Choose a board: - Arduino + Ethernet shield, or - ESP32 with WiFi (using HTTP client libraries instead of Ethernet).2. Configure the board with: - the IP/hostname of your Flask/MySQL/SQLite server (Pi or laptop) - a unique `DEVICE_ID` that exists in the database3. Port the example sketch from Chapter 13: - read one or more sensors (e.g., DHT11/22 for temperature/humidity) - build and send HTTP requests with query parameters or JSON bodies - print responses to Serial for debugging4. Monitor: - database rows as they arrive - error handling behaviour when the network or server is unavailable5. Reflect on storage strategy: - what data stays at the edge (Pi/local DB) vs what goes to the cloud? - how would you buffer and replay data during outages?This lab connects directly to LAB12: the streams you processed there can now be persisted and queried using the ingestion patterns from LAB13.:::## Related Labs::: {.callout-tip}## Distributed Systems- **LAB09: ESP32 Wireless** - Send sensor data via WiFi/MQTT- **LAB12: Streaming** - Real-time data ingestion and processing- **LAB17: Federated Learning** - Distributed training across edge nodes:::::: {.callout-tip}## Data Management- **LAB08: Arduino Sensors** - Data collection at the edge- **LAB14: Anomaly Detection** - Query stored data for anomalies:::## Related Resources- [Hardware Guide](../resources/hardware.qmd) - Equipment needed for Level 3- [Troubleshooting](../resources/troubleshooting.qmd) - Common issues and solutions