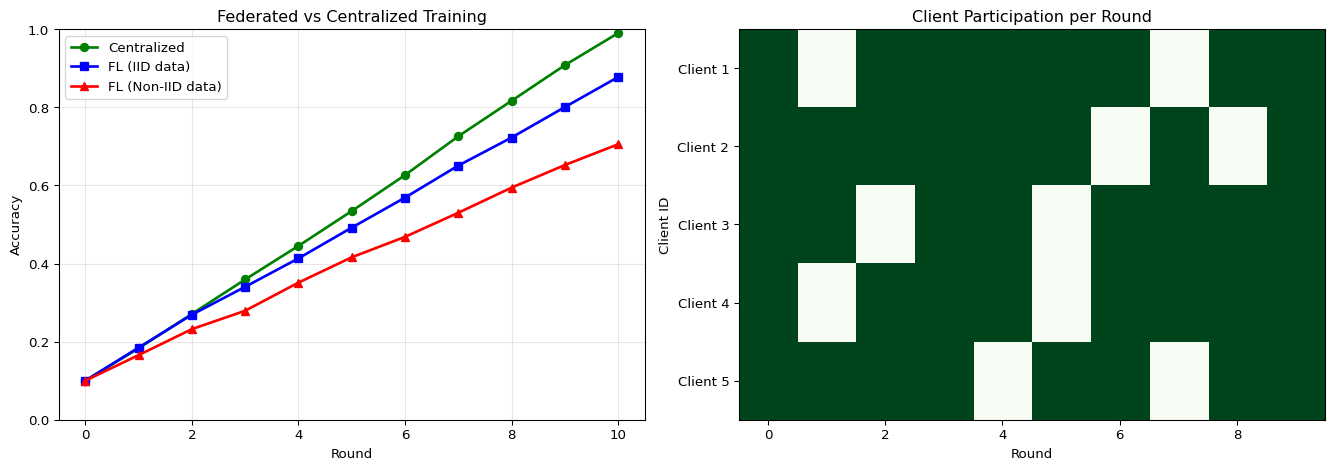
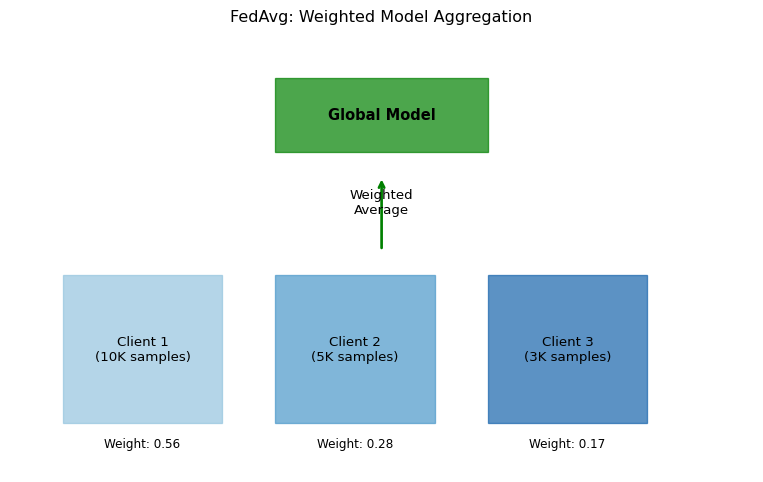
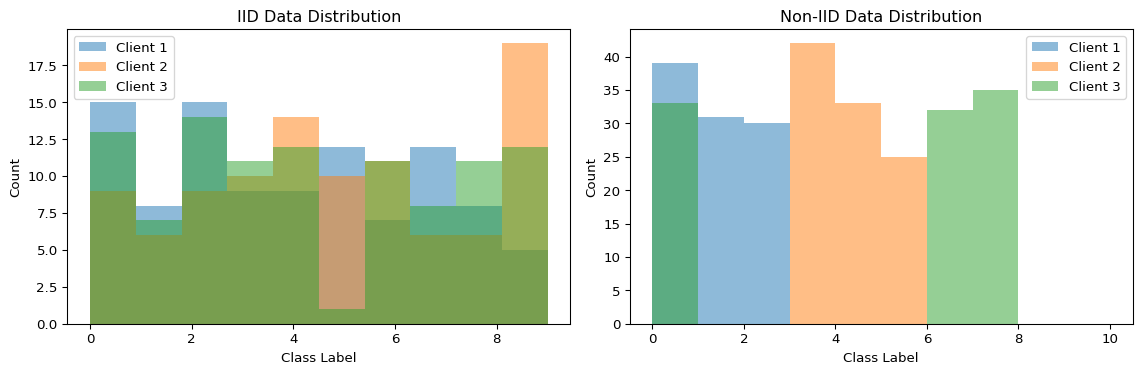
--- title: "Federated Learning Simulator" subtitle: "LAB17: Federated Learning with Flower" --- ## Visualize Distributed Model Training ## Concept from LAB17 [ PDF book ](../downloads/Edge-Analytics-Lab-Book-v1.0.0.pdf) .## Interactive FL Simulator ```{ojs} //| echo: false viewof numClients = Inputs.range([2, 20], { value: 5, step: 1, label: "Number of Clients", description: "Devices participating in federated training" }) viewof numRounds = Inputs.range([5, 50], { value: 10, step: 1, label: "Training Rounds", description: "Number of federated aggregation rounds" }) viewof nonIIDDegree = Inputs.range([0, 1], { value: 0.3, step: 0.1, label: "Non-IID Degree", description: "0=IID (balanced), 1=Non-IID (highly skewed)" }) viewof clientParticipation = Inputs.range([0.2, 1], { value: 0.8, step: 0.1, label: "Client Participation Rate", description: "Fraction of clients active per round" }) viewof localEpochs = Inputs.range([1, 10], { value: 3, step: 1, label: "Local Epochs", description: "Training epochs per client before aggregation" }) ``` ```{ojs} //| echo: false // Simulate federated learning function simulateFederatedLearning(clients, rounds, nonIID, participation, epochs) { const baseAccuracy = 0.1; const targetAccuracy = 0.95; const results = { rounds: [], clients: [] }; // Initialize clients with different data distributions const clientData = Array.from({length: clients}, (_, i) => { const dataSize = 500 + Math.random() * 1000; // Non-IID: each client specializes in different classes const specialization = nonIID > 0.5 ? (i % 3) : -1; return { id: i, dataSize: dataSize, specialization: specialization, accuracy: baseAccuracy }; }); let globalAccuracy = baseAccuracy; for (let round = 0; round < rounds; round++) { // Randomly select participating clients const activeClients = clientData.filter(() => Math.random() < participation); // Each client trains locally const updates = activeClients.map(client => { // Improvement depends on local epochs and data quality const dataQuality = nonIID > 0.5 ? 0.7 : 1.0; const improvement = (0.08 + Math.random() * 0.04) * epochs * dataQuality; const newAccuracy = Math.min(targetAccuracy, globalAccuracy + improvement); client.accuracy = newAccuracy; return { clientId: client.id, accuracy: newAccuracy, weight: client.dataSize }; }); // FedAvg: weighted average const totalData = updates.reduce((sum, u) => sum + u.weight, 0); globalAccuracy = updates.reduce((sum, u) => sum + (u.accuracy * u.weight / totalData), 0 ); // Add some noise based on non-IID globalAccuracy += (Math.random() - 0.5) * 0.02 * nonIID; globalAccuracy = Math.max(baseAccuracy, Math.min(targetAccuracy, globalAccuracy)); results.rounds.push({ round: round, globalAccuracy: globalAccuracy, activeClients: activeClients.length, avgClientAccuracy: updates.reduce((s, u) => s + u.accuracy, 0) / updates.length }); } results.clients = clientData; return results; } flResults = simulateFederatedLearning(numClients, numRounds, nonIIDDegree, clientParticipation, localEpochs) html`<div style="background: linear-gradient(135deg, #8b5cf6 0%, #ec4899 100%); padding: 25px; border-radius: 10px; color: white; margin: 20px 0;"> <h3 style="margin-top: 0;">Federated Learning Simulation</h3> <div style="display: grid; grid-template-columns: repeat(auto-fit, minmax(180px, 1fr)); gap: 15px; margin-top: 15px;"> <div style="background: rgba(255,255,255,0.15); padding: 15px; border-radius: 8px;"> <div style="font-size: 2em; font-weight: bold;">${(flResults.rounds[flResults.rounds.length-1].globalAccuracy * 100).toFixed(1)}%</div> <div style="opacity: 0.9;">Final Accuracy</div> <div style="font-size: 0.85em; margin-top: 5px; opacity: 0.8;">After ${numRounds} rounds</div> </div> <div style="background: rgba(255,255,255,0.15); padding: 15px; border-radius: 8px;"> <div style="font-size: 2em; font-weight: bold;">${numClients}</div> <div style="opacity: 0.9;">Total Clients</div> <div style="font-size: 0.85em; margin-top: 5px; opacity: 0.8;">${(clientParticipation * 100).toFixed(0)}% participation</div> </div> <div style="background: rgba(255,255,255,0.15); padding: 15px; border-radius: 8px;"> <div style="font-size: 2em; font-weight: bold;">${numRounds * Math.round(numClients * clientParticipation)}</div> <div style="opacity: 0.9;">Total Updates</div> <div style="font-size: 0.85em; margin-top: 5px; opacity: 0.8;">Client contributions</div> </div> </div> </div>` ``` ## Convergence Over Rounds ```{ojs} //| echo: false // Also simulate centralized training for comparison centralizedData = Array.from({length: numRounds}, (_, i) => { const improvement = 0.09; const accuracy = Math.min(0.95, 0.1 + i * improvement); return { round: i, accuracy: accuracy, type: "Centralized" }; }) // Combine FL and centralized data convergenceData = [ ...flResults.rounds.map(r => ({ round: r.round, accuracy: r.globalAccuracy, type: "Federated Learning" })), ...centralizedData ] Plot.plot({ height: 400, x: {label: "Training Round", grid: true}, y: {label: "Global Model Accuracy", domain: [0, 1]}, color: { domain: ["Federated Learning", "Centralized"], range: ["#8b5cf6", "#10b981"] }, marks: [ Plot.line(convergenceData, { x: "round", y: "accuracy", stroke: "type", strokeWidth: 3 }), Plot.dot(convergenceData.filter(d => d.type === "Federated Learning"), { x: "round", y: "accuracy", fill: "#8b5cf6", r: 4 }), Plot.ruleY([0.9], { stroke: "#94a3b8", strokeDasharray: "4,4" }), Plot.text([{x: numRounds * 0.95, y: 0.9, label: "Target"}], { x: "x", y: "y", text: "label", textAnchor: "end", dy: -8, fill: "#64748b", fontSize: 11 }) ] }) html`<div style="margin-top: 15px; padding: 15px; background: #f0f9ff; border-radius: 8px;"> <strong>Note:</strong> Centralized training typically converges faster but requires centralizing all data. Federated learning preserves privacy at the cost of slightly slower convergence, especially with non-IID data. </div>` ``` ## Client Participation Matrix ```{ojs} //| echo: false // Generate client participation data participationMatrix = Array.from({length: numRounds}, (_, round) => Array.from({length: numClients}, (_, client) => ({ round: round, client: client, active: Math.random() < clientParticipation ? 1 : 0 })) ).flat() Plot.plot({ height: Math.max(200, numClients * 20), marginLeft: 80, x: {label: "Training Round"}, y: {label: "Client ID", domain: Array.from({length: numClients}, (_, i) => i)}, color: { domain: [0, 1], range: ["#f1f5f9", "#8b5cf6"], legend: true, label: "Active" }, marks: [ Plot.cell(participationMatrix, { x: "round", y: "client", fill: "active", inset: 0.5 }) ] }) ``` ```{python} #| label: fig-fl-convergence #| fig-cap: "Federated learning convergence across rounds" import numpy as npimport matplotlib.pyplot as plt42 )# Simulate FL training = 10 = 5 # Simulated accuracy trajectories def simulate_fl_training(num_rounds, num_clients, iid= True ):"""Simulate federated learning convergence""" = [0.1 ] # Start at random for round_num in range (num_rounds):# Each client trains locally = []for c in range (num_clients):if iid:# IID data: similar improvement = 0.08 + np.random.normal(0 , 0.01 )else :# Non-IID: more variance = 0.06 + np.random.normal(0 , 0.03 )= min (0.99 , global_accuracy[- 1 ] + improvement)# FedAvg aggregation = np.mean(client_accuracies)return global_accuracy# Simulate IID vs Non-IID = simulate_fl_training(num_rounds, num_clients, iid= True )= simulate_fl_training(num_rounds, num_clients, iid= False )# Also simulate centralized training for comparison = [0.1 ]for _ in range (num_rounds):= 0.09 + np.random.normal(0 , 0.005 )min (0.99 , centralized_accuracy[- 1 ] + improvement))# Plot = plt.subplots(1 , 2 , figsize= (14 , 5 ))# Convergence comparison = axes[0 ]= range (num_rounds + 1 )'g-o' , label= 'Centralized' , linewidth= 2 )'b-s' , label= 'FL (IID data)' , linewidth= 2 )'r-^' , label= 'FL (Non-IID data)' , linewidth= 2 )'Round' )'Accuracy' )'Federated vs Centralized Training' )True , alpha= 0.3 )0 , 1 )# Client participation = axes[1 ]= np.random.rand(num_rounds, num_clients) > 0.2 # 80% participation = ax.imshow(client_data.T, cmap= 'Greens' , aspect= 'auto' )'Round' )'Client ID' )'Client Participation per Round' )range (num_clients))f'Client { i+ 1 } ' for i in range (num_clients)])``` ## FedAvg Algorithm - $K$ = number of clients- $n_k$ = samples at client $k$- $n = \sum_k n_k$ = total samples- $w_k^{t+1}$ = client $k$'s model after local training```{python} #| label: fig-fedavg #| fig-cap: "FedAvg weighted aggregation" = plt.subplots(figsize= (10 , 6 ))# Visualize weighted aggregation = ['Client 1 \n (10K samples)' , 'Client 2 \n (5K samples)' , 'Client 3 \n (3K samples)' ]= [10000 , 5000 , 3000 ]= np.array(samples) / sum (samples)= plt.cm.Blues(np.linspace(0.4 , 0.8 , len (clients)))# Draw clients for i, (client, w, color) in enumerate (zip (clients, weights, colors)):* 2 , 0 ), 1.5 , 3 , color= color, alpha= 0.7 ))* 2 + 0.75 , 1.5 , client, ha= 'center' , va= 'center' , fontsize= 10 )* 2 + 0.75 , - 0.5 , f'Weight: { w:.2f} ' , ha= 'center' , fontsize= 9 )# Draw aggregation arrow '' , xy= (3 , 5 ), xytext= (3 , 3.5 ),= dict (arrowstyle= '->' , lw= 2 , color= 'green' ))3 , 4.25 , 'Weighted \n Average' , ha= 'center' , fontsize= 10 )# Draw global model 2 , 5.5 ), 2 , 1.5 , color= 'green' , alpha= 0.7 ))3 , 6.25 , 'Global Model' , ha= 'center' , va= 'center' , fontsize= 11 , fontweight= 'bold' )- 0.5 , 6.5 )- 1 , 8 )'off' )'FedAvg: Weighted Model Aggregation' , fontsize= 12 )``` ## Non-IID Data Challenge ```{python} #| label: fig-non-iid #| fig-cap: "IID vs Non-IID data distribution" = plt.subplots(1 , 2 , figsize= (12 , 4 ))# IID distribution = axes[0 ]for c in range (3 ):= np.random.randint(0 , 10 , 100 )= 10 , alpha= 0.5 , label= f'Client { c+ 1 } ' )'Class Label' )'Count' )'IID Data Distribution' )# Non-IID distribution (each client has different classes) = axes[1 ]for c in range (3 ):# Each client mainly has 2-3 classes = [c* 3 , c* 3 + 1 , c* 3 + 2 if c < 2 else 0 ]= np.random.choice(main_classes, 100 )= 10 , range = (0 , 10 ), alpha= 0.5 , label= f'Client { c+ 1 } ' )'Class Label' )'Count' )'Non-IID Data Distribution' )``` ## Key Insights ## Try It Yourself ```python # Simulate FL with Flower import flwr as fl# Start server = fl.server.ServerConfig(num_rounds= 5 ),# Start clients (run in separate terminals) = "localhost:8080" ,= MyClient()``` ## Related Sections in PDF Book - Section 17.1: Why Federated Learning?- Section 17.2: The FedAvg Algorithm- Section 17.3: Handling Non-IID Data- Exercise 17.1: Implement FL on Raspberry Pi cluster